The cure for homesickness

Chouette!
Chouette!
Subbu Allamaraju on the Facebook Graph API and links
It is interconnected as every representation is linked to related resources. For instance, an album representation is linked to the profile that posted the album. Each user representation is linked to a collection of groups that the user is member of. This is hypermedia in action. Hypermedia does not have to be complicated – and Facebook just proves it.
Twitter annotations seem to make some great new location applications possible. Agree on a key, use a URI that resolves to a map or KML as a value, and you're on the map.
I've been slow to catch up with Microsoft's OData initiative, but saw a link to geographic OData in the blog of Michael Hausenblas: Edmonton bus stops.
It's an Atom feed with extensions, including location,
<content type="application/xml">
  <m:properties>
    <d:PartitionKey>1000</d:PartitionKey>
    <d:RowKey>3b57b81c-8a36-4eb7-ac7f-31163abf1737</d:RowKey>
    <d:Timestamp m:type="Edm.DateTime">2010-01-14T22:43:35.7527659Z</d:Timestamp>
    <d:entityid m:type="Edm.Guid">b0d9924a-8875-42c4-9b1c-246e9f5c8e49</d:entityid>
    <d:stop_number>1000</d:stop_number>
    <d:street>Abbottsfield</d:street>
    <d:avenue>Transit Centre</d:avenue>
    <d:region>Edmonton</d:region>
    <d:latitude m:type="Edm.Double">53.57196999</d:latitude>
    <d:longitude m:type="Edm.Double">-113.3901687</d:longitude>
    <d:elevation m:type="Edm.Double">0</d:elevation>

  </m:properties>
</content>
but the location is tied up inside an OData payload. A GeoRSS processor (such as GMaps) has no clue [map].
Pleiades is also taking an Atom-based approach to data, but does use GeoRSS. There were no bus stops back in the day, but there were bridges [map].
Comments on Michael's blog post indicate that OData is designed around "rectangular" rather than "linked" data. Atom as an envelope for tabular, CSV-like, data (like KML's extended data). Atom's content element was designed to accomodate this, but it seems clear to me that data, especially standard stuff like geographic location, is more visible outside the payload.
Scroll down on http://pypi.python.org/pypi/Shapely/1.2b6 to see the links for installers for Python versions 2.4/5/6. These are produced by Jakko Salli and contain GEOS 3.2.0 DLLs.
Author: vincent
I happened to have installed 1.2b6 on windows yesterday with the tarball, and geos 3.2.0 dll files from postgis renamed to 3.0.0. Worked, but ugly hack. Good to have a real good solution now, thanks Jakko !
Busy day in the labo. Version 0.6 of Rtree, the N-dimensional R-tree package for Python, is ready.
All,
It is my pleasure to announce the release of Rtree 0.6.0.
http://pypi.python.org/pypi/Rtree/
Source code and a complete Windows self-installer (with libspatialindex 1.5.0) are provided. Version 0.6.0 requires the use of libspatialindex 1.5.0, and it will not work without it.
The following updates were made for this release:
0.6.0 relies on libspatialindex 1.5.0+.
Intersection and nearest methods return iterators over results instead of lists.
Number of results for nearest() defaults to 1.
libsidx C library of 0.5.0 removed and included in libspatialindex
objects="raw" to return the object sent in (for speed).
.count() method to return the intersection count without the overhead of returning a list. (thanks Leonard Norrgård)
Improved bulk loading performance
Supposedly no memory leaks :)
Many other performance tweaks (see docs).
Bulk loader supports interleaved coordinates
Leaf queries. You can return the box and ids of the leaf nodes of the index. Useful for visualization, etc.
Many more docstrings, sphinx docs, etc
Howard, Brent, and Sean
Permanent link to the announcement: http://lists.gispython.org/pipermail/community/2010-April/002500.html.
GitHub users might be interested in forking http://github.com/sgillies/rtree. I'll keep it up date with and push contributions to the canonical Rtree Subversion repository.
New C API and 64-bit support for the N-dimensional R/MVR/TPR-tree library:
All,
It is my pleasure to announce the release of libspatialindex 1.5.0. You can obtain source and compiled windows versions from:
http://trac.gispython.org/spatialindex/wiki/Releases
Additionally, I have also updated the OSGeo4W release with a 1.5.0 version as well for people using it through that avenue.
The big items addressed in 1.5.0 were:
Do not depend on size_t for storages. This change is backward incompatible, but it allows stored indexes to be 32/64 platform agnostic. http://trac.gispython.org/spatialindex/ticket/20
A C API has been added. The C API provides a nice fuzzy blanket for this wishing to insulate themselves from righteous C++ programming. In exchange for holding your hand and making choices for you at almost every level, it is rather easy to use and provides some good example code for those looking to do different things with the library. http://trac.gispython.org/spatialindex/ticket/23
More detail provided at http://trac.gispython.org/spatialindex/query?status=closed&group=resolution&milestone=1.5
Howard
This library originated in work by Hadjieleftheriou [1] and is used by Rtree. Permanent link to the announcement: http://lists.gispython.org/pipermail/spatialindex/2010-April/000186.html.
Update (2010-04-28): 1.2b7 has another important bug fix. Links are updated below.
Update (2010-04-13): 1.2b6 has an important bug fix. Links are updated below.
Shapely 1.2b5 is uploaded to http://pypi.python.org/pypi/Shapely and http://gispython.org/dist/. It contains a few enhancements that suggested themselves while I was writing example code for the user manual.
To install and try it out (in a virtualenv):
or
A sneak preview of the (still in progress) manual for 1.2 is online at a non-permanent URI: http://gispython.org/shapely-1.2/manual/manual.html. Feedback on the HTML has been positive. I hope that the content is (or will be) even better. There are copious code examples and figures (with code) made using descartes. A lot of the discussion is based on Martin Davis's JTS docs, without which I'd be nowhere.
In other Shapely news, the project in which it originated has been refunded and will be the biggest part of my job over the next few years. Count on improvements to the code and the docs.
Update (2010-04-10): http://pypi.python.org/pypi/descartes/0.1.2 adds support for GeoJSON-like objects and objects that provide the Python geo interface.
Update (2010-04-08): I've uploaded descartes 0.1, which now supports GeoJSON-like dicts (also known as "Python geo interface"), to http://pypi.python.org/pypi/descartes/0.1.
I've been making figures for the upcoming new version of the Shapely manual and developed some Shapely/matplotlib utility code that might be useful to others. The PolygonPatch class from descartes.patch takes care of all the fussy details of path creation, reducing the plotting of any polygon to a single line of code.
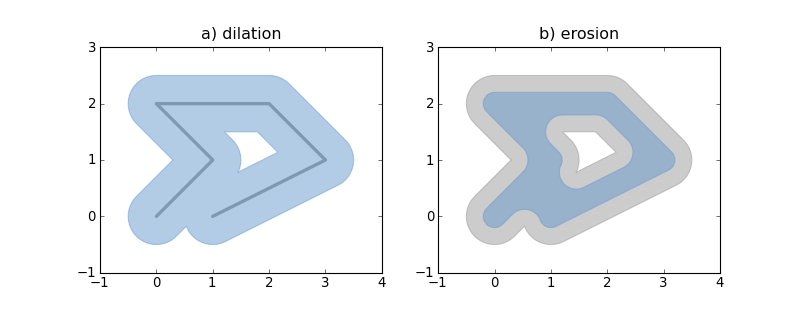
The plot on the left shows a line (grey) dilated to produce a polygon (blue). The plot on the right shows that same polygon (gray) eroded to produce a new polygon (blue).
from matplotlib import pyplot
from shapely.geometry import LineString
from descartes.patch import PolygonPatch

fig = pyplot.figure(1, figsize=(10, 4), dpi=180)

# Plot 1: dilating a line
line = LineString([(0, 0), (1, 1), (0, 2), (2, 2), (3, 1), (1, 0)])
ax = fig.add_subplot(121)
dilated = line.buffer(0.5)
patch1 = PolygonPatch(dilated, facecolor='#99ccff', edgecolor='#6699cc')
ax.add_patch(patch1)
x, y = line.xy
ax.plot(x, y, color='#999999')
ax.set_xlim(-1, 4)
ax.set_ylim(-1, 3)

# Plot 2: eroding the polygon from 1
ax = fig.add_subplot(122)
patch2a = PolygonPatch(dilated, facecolor='#cccccc', edgecolor='#999999')
ax.add_patch(patch2a)
eroded = dilated.buffer(-0.3)
patch2b = PolygonPatch(eroded, facecolor='#99ccff', edgecolor='#6699cc')
ax.add_patch(patch2b)
ax.set_xlim(-1, 4)
ax.set_ylim(-1, 3)

pyplot.show()
See http://bitbucket.org/sgillies/descartes/ for code and more examples.
Update (2010-04-15): See also http://sgillies.net/blog/1014/descartes.
With the help of this old matplotlib-users post, I've figured out how to use Path and PathPatch to draw polygons with truly empty holes.
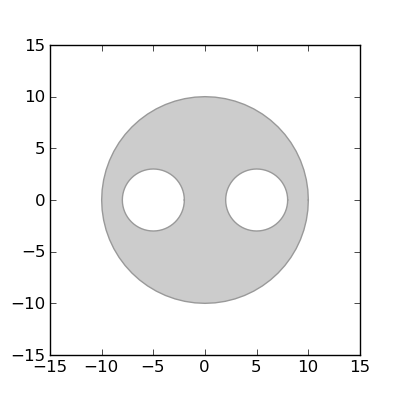
The code below constructs an approximately circular, doubly-holed region by buffering a point and taking the difference with a buffered pair of points, converts its boundaries to a matplotlib path, and renders this as a patch. Shapely (or rather GEOS) does the right thing with coordinate ordering, making it rather easy and efficient.
from matplotlib import pyplot
from matplotlib.path import Path
from matplotlib.patches import PathPatch
from numpy import asarray, concatenate, ones
from shapely.geometry import *

def ring_coding(ob):
    # The codes will be all "LINETO" commands, except for "MOVETO"s at the
    # beginning of each subpath
    n = len(ob.coords)
    codes = ones(n, dtype=Path.code_type) * Path.LINETO
    codes[0] = Path.MOVETO
    return codes

def pathify(polygon):
    # Convert coordinates to path vertices. Objects produced by Shapely's
    # analytic methods have the proper coordinate order, no need to sort.
    vertices = concatenate(
                    [asarray(polygon.exterior)]
                    + [asarray(r) for r in polygon.interiors])
    codes = concatenate(
                [ring_coding(polygon.exterior)]
                + [ring_coding(r) for r in polygon.interiors])
    return Path(vertices, codes)

polygon = Point(0, 0).buffer(10.0).difference(
    MultiPoint([(-5, 0), (5, 0)]).buffer(3.0))

fig = pyplot.figure(num=1, figsize=(4, 4), dpi=180)
ax = fig.add_subplot(111)

path = pathify(polygon)
patch = PathPatch(path, facecolor='#cccccc', edgecolor='#999999')

ax.add_patch(patch)

ax.set_xlim(-15, 15)
ax.set_ylim(-15, 15)
ax.set_aspect(1.0)

fig.savefig('polygon-holes.png')
No more faking it.
Comments
Re: Geo-annotating tweets
Author: Alex
I have two (completely different) suggestions for this:
For one, i've created a URI scheme named "geo:" with a friend of mine - it's currently going through IETF standardization, and will be a Standards Track RFC soon: http://datatracker.ietf.org/doc/draft-ietf-geopriv-geo-uri/ - The nice thing about "geo" URIs is that they are independent of any web mapping service - the URI itself contains the coordinates. Given that this is going to be an RFC soon, it should be supported quite broadly - Android phones do already support such addresses!
Second, i'm running a short URL service at http://xm.my/ specifically for creating short links for maps. Space might not be a problem in Tweet Annotations, but it's still useful to have very short links for map services if you want to include the link in the Tweet itself. An example of such a map is http://xm.my/sjGQ
Alex
Re: Geo-annotating tweets
Author: Sean
I prefer http: URIs because they leverage all of HTTP and the web and aren't limited to single points on the globe. They're useful for identifying complex features that would overflow conventional limits on URI length and for identifying "fuzzy" or fictional places.