Painting punctured polygons with matplotlib
Update (2010-04-15): See also http://sgillies.net/blog/1014/descartes.
With the help of this old matplotlib-users post, I've figured out how to use Path and PathPatch to draw polygons with truly empty holes.
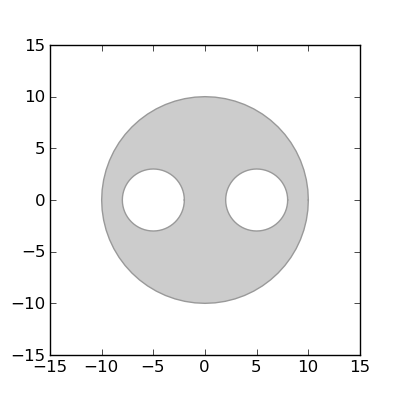
The code below constructs an approximately circular, doubly-holed region by buffering a point and taking the difference with a buffered pair of points, converts its boundaries to a matplotlib path, and renders this as a patch. Shapely (or rather GEOS) does the right thing with coordinate ordering, making it rather easy and efficient.
from matplotlib import pyplot
from matplotlib.path import Path
from matplotlib.patches import PathPatch
from numpy import asarray, concatenate, ones
from shapely.geometry import *

def ring_coding(ob):
    # The codes will be all "LINETO" commands, except for "MOVETO"s at the
    # beginning of each subpath
    n = len(ob.coords)
    codes = ones(n, dtype=Path.code_type) * Path.LINETO
    codes[0] = Path.MOVETO
    return codes

def pathify(polygon):
    # Convert coordinates to path vertices. Objects produced by Shapely's
    # analytic methods have the proper coordinate order, no need to sort.
    vertices = concatenate(
                    [asarray(polygon.exterior)]
                    + [asarray(r) for r in polygon.interiors])
    codes = concatenate(
                [ring_coding(polygon.exterior)]
                + [ring_coding(r) for r in polygon.interiors])
    return Path(vertices, codes)

polygon = Point(0, 0).buffer(10.0).difference(
    MultiPoint([(-5, 0), (5, 0)]).buffer(3.0))

fig = pyplot.figure(num=1, figsize=(4, 4), dpi=180)
ax = fig.add_subplot(111)

path = pathify(polygon)
patch = PathPatch(path, facecolor='#cccccc', edgecolor='#999999')

ax.add_patch(patch)

ax.set_xlim(-15, 15)
ax.set_ylim(-15, 15)
ax.set_aspect(1.0)

fig.savefig('polygon-holes.png')
No more faking it.