Modeling historical places for Pleiades

There have been a few recent calls for humanities researchers and informaticians to write more about their models of temporal and geographic data. The one I'm working on (Pleiades, a gazetteer and more) is preparing to evolve, so this is a good time to write about its current state and future directions.

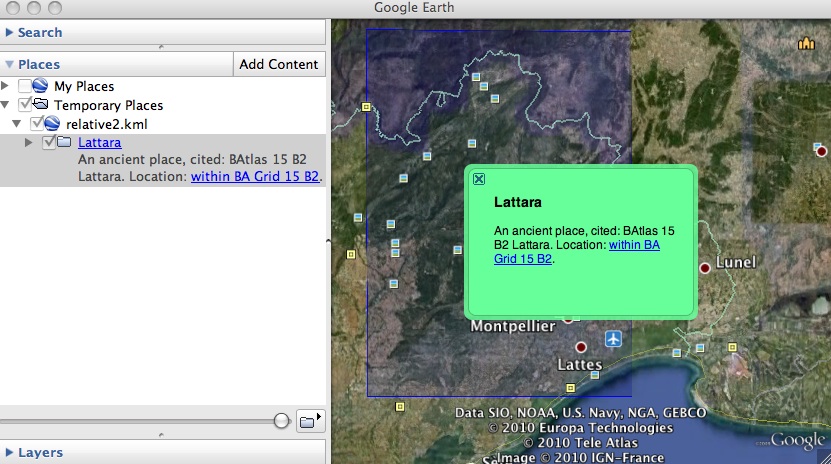
That a place is more than its longitude and latitude coordinates has long been recognized. It's not just that a single point insufficiently describes a place known as "Lattara", but also that no ensemble of 2D or 3D geometric objects – points, lines, or polygons – sufficiently describes that place. Place is also determined by history, by language, by populations, by human experience. Yi-fu Tuan [1] writes:

Experience constructs place at different scales. The fireplace and the home are both places. Neighborhood, town, and city are places: a distinctive region is a place, and so is a nation.

Pleiades is primarily concerned with two characteristics of ancient world places: locations and names. We consider these distinct entities. The cardinality and navigability of the relationships are not much different than those in the CIDOC CRM [2]. In our case we have accompanying assertions and evidence that only make sense within the context of a place, so we have a composition relationship.

http://sgillies.net/images/ClassDiagram-1.png

Among other attributes, Locations and Names have attested time periods (shown) with confidence measures and evidence (not shown). Temporal modeling isn't something we're going to get into here; in brief, Pleiades has an open vocabulary of time periods that can grow to suit users. The initial time periods (inherited from the Barrington Atlas) are quite coarse, but suffice for study or visualization of change between major eras. One can think of Names and Locations as broad events instead of snapshots in time and thereby partly escape the conceptual box of time-ordered footprints identified by Mostern and Johnson [3]. Politics or the movement of people sweep away old names and bring new ones. Settlements grow and fade, coastlines shift. Pleiades can document what is known about these episodes.

In the CRM, names and coordinates are generalizations of "E44 Place Appellation". We don't model this in the same way, although some of the intended consequences manifest themselves in the way we implement composition: one can readily find "place 42" by following the links embedded in the representations at (for example) /places/42/name(foo) or /places/42/location(bar) and in that sense, they do label the place.

The CRM, by the way, is as open-minded (or more) about place as Tuan: the deck of the H. M. S. Victory is considered a place and the lower right corner of a painting depicting Admiral Nelson's death is considered a place. We wouldn't prevent a user from submitting the bottom step of the Scalae Gemoniae as a place, I suppose, but Pleiades isn't aimed at this scale.

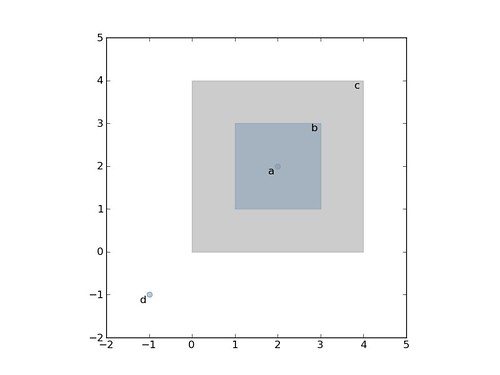
There's a lot we can do with the simple model shown above. We can identify unlocated places mentioned in ancient texts but never conclusively surveyed by archaeologists. We can identify the sites of excavated ancient places that yield no clue to their names. We can identify fictional places. We can collect arguments and evidence. We can share identifiers across the web. Yet, there are a few interesting ways to look at places that we can't support.

We don't allow aggregation of places to create hierarchies or places that are known only by sum of their parts. See for example Smith's [4] chapter on Gallia Cisalpina (emphasis mine):

The Boii occupied the country along the south side of the Po to the foot of the Apennines, and the northern slopes of these mountains. Their limits can only be approximated to by mentioning the towns within their territory. Bononia, originally called Felsina, when it was an Etruscan city, was one of them, and Mutina and Parma were two others. Placentia, near the junction of the Trebia and the Po, may have been within their limits; if it was not, we must place it in the country of the Ananes.

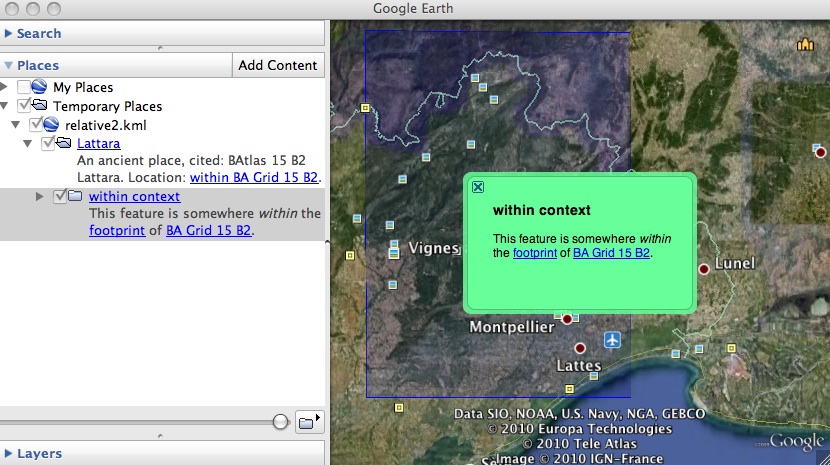
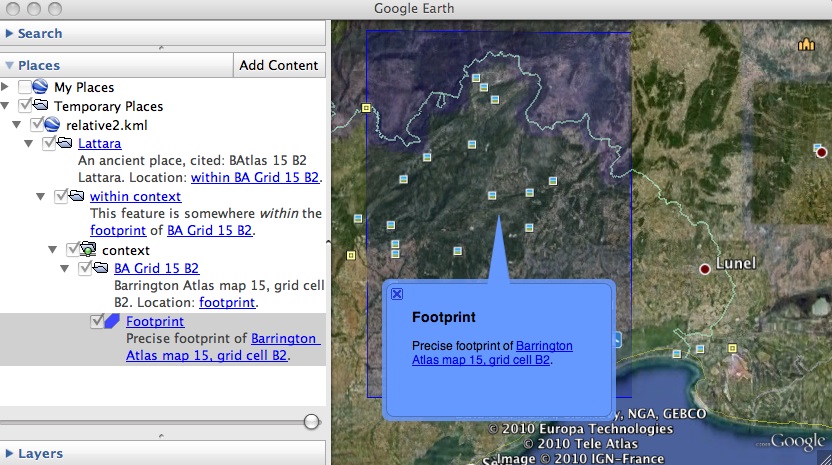
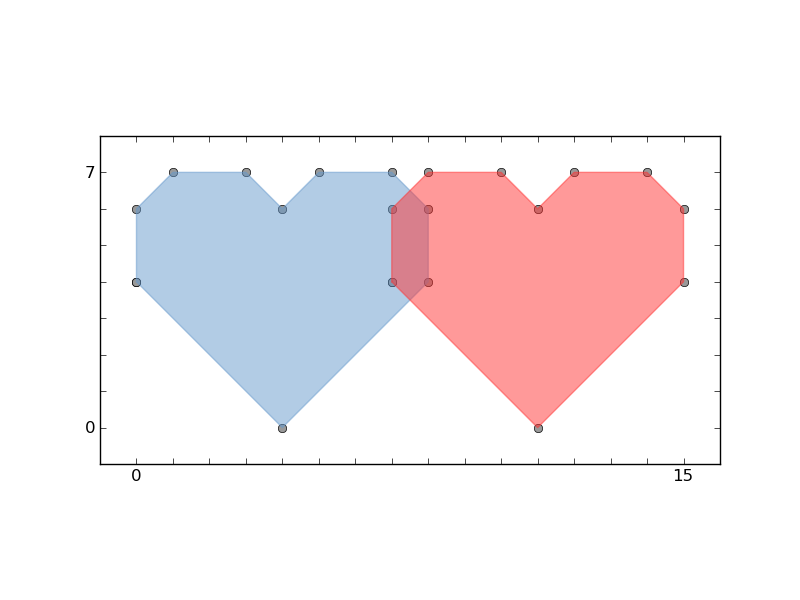
We've special-cased fuzzy locations such as "within the Barrington Atlas map 15 grid cell B2" but don't otherwise have a way for users to express fuzzy or relative locations like those in the same chapter (emphasis mine):

A new band according to Livy's authorities soon crossed the Alps by the same pass, the Cenomani (Liv. 5.35) under Elitovius, and occupied the places where in Livy's time Brixia (Brescia) and Verona were: the Libui were the previous occupiers of these parts. Livy may not have perceived that he has already mentioned (5.34) the Aulerci as Gallic invaders of Italy, and that the Cenomani were a division of the Aulerci. [CENOMANI] Cato found a tradition somewhere (Plin. Nat. 3.19) that the Cenomani once dwelt near Massilia (Marseille) in the country of the Volcae, which, if the tradition is true, may have been during their migration from their original country between the Loire and the Seine. The Cenomani (Livy) were followed by the Salluvii, who settled near “an ancient people, Laevi, Ligures,” as some texts have it, “who dwelt about the river Ticinus.” But here Livy has not observed, though he knew the fact, that the Salluvii or Salyes were Ligurians, and dwelt between the Lower Rhone and the Alps. In this passage (5.35) perhaps he may mean the Salassi.

The Barrington Atlas map-by-map directories include entries for ancient road networks such as this stretch of the Via Postumia in Map 39:

Augusta Taurinorum → Forum Vibii → *Forum Germanici → Pedo(na)

but we're not yet able to store these in a form that allows network analysis.

Changes to the model that would allow us to cover the new use cases are sketched out below.

http://sgillies.net/images/ClassDiagram-2.png

The Feature interface in the diagram allows a clearer diagram. In practice it will be provided by Place entities. The "connected to" relationship would let us form graphs and do simple analysis of trade networks even in the absence of surveyed roadways. The "has part" relationship would let us generate rough spatial extents for aggregate places without falsely asserting any exact boundaries to them. An set of "relates to" relationships will let us put fuzzily or relatively located places "on the map".

I'm simultaneously writing about the effort to design representations of these entities for the web here and here. In the near future, I'd like to explain more about the evidentiary entities in light of Sebastian Heath's research.

By coincidence, as I'm writing this and citing Ruth Mostern (disclosure: Prof. Mostern was on the original Pleiades steering committee), I got word of the publication of version 1.1 of the Digital Gazetteer of the Song Dynasty (CC by-nc-sa) she has produced with Elijah Meeks. Their entity model is shown at http://songgis.ucmercedlibrary.info/?page_id=94.

Python GIS workshop at FOSS4G

FOSS4G workshop W-06 looks like a bonanza:

Python is becoming a solid development platform for the web and the geospatial domain. One of the advantages of Python for developing GIS applications is the number of high-quality tools it counts in the geospatial domain. Examples include Shapely, Mapnik, GeoDjango, TileCache, Python bindings for OGR/GDAL. This workshop presents a number of Python tools, libraries and frameworks, and shows how to use them together to create solid and efficient web-mapping applications. More specifically, the workshop covers the Shapely and GeoJSON libraries from the GIS Python Lab. It shows how to use these libraries together with SQLAlchemy and its GIS extension, GeoAlchemy, to create HTTP web services in an application developed with the Pylons web development framework. The workshop then teaches how to use MapFish to make the development of GIS web services easier. Finally the workshop demonstrates how to secure tile accesses by pluging TileCache in a MapFish application and making use of repoze.who and repoze.what for the security layer.

Comments

Pylons

Author: Kurt Schwehr

That's quite the list of python packages to cover. Thanks for the post as I had been interest in pylons, but I got annoyed that they were not doing point release tars before. You caused me to go an look... and they now have a pylons 1.0 tar. Yeah!

Fuzzy and relative places in KML 2

I've got more (previously) half-baked thoughts on handling the fuzziness or relativity of places and their locations in KML. There are two sides to this issue: 1) a interface based on visual metaphors and hypertext through which a user can navigate fuzzy waters, and 2) an encoding of the fuzziness so that a machine can make sense of it when user-modified KML is uploaded.

One possible user interface is driven by HTML anchors and links to other KML entities within Feature descriptions [reference]: http://sgillies.net/files/relative2.kml.

In this KML there is a representation of a place (labeled "Lattara") with a location that is known only from a gazetteer (in the back of my atlas) to be within the earthly footprint of the Barrington Atlas map 15 grid cell B2. The location of ancient Lattara is actually well known (and the museum dedicated to it in Lattes is a must-visit), but let's imagine it is not, and until I reconcile Pleiades with a big batch of updates coming soon from a partner institution, many of our places are in this state: known only to be within a lat/long rectangle. A nice feature of our model is we can identify places by URI without knowing their locations or coordinates precisely. The spatial data is added as we get it. You'll recognize that this is absolutely not the GIS way of doing things.

The simple place browsing user interface that surfaces in Google Earth from relative2.kml isn't terrible: click on the "Lattara" folder in the left pane and we get a free floating popup with a link to a location.

http://farm5.static.flickr.com/4005/4646733433_dd87285b44_o_d.jpg

Click that link and we traverse to the location, which has more links to its spatial context.

http://farm4.static.flickr.com/3399/4647348632_f1728084d6_o_d.jpg

Click on the "footprint" context link and we get an anchored popup.

http://farm5.static.flickr.com/4011/4646733579_5d1fb226ef_o_d.jpg

By representing the fuzzy location as a KML Folder containing a NetworkLink, my intention is better expressed in Google Maps than previously [map]. Every item of interest shows up in the pane on the left. Unfortunately, there are still no free floating popups for the "Lattara" and "within context" items. It's quite possible that I'm missing something, but it looks like Google Earth and Maps behave differently. A close look at the DOM of a Maps page post-load shows that there's no snippet div to be shown in a popup for item that's not a placemark.

I think what I need is way to represent the "within" relationship (or others) as a placemark – and this is where the issue (2) of machine readability comes up – without asserting that its position in the map marks the actual location of a place. Maybe KARML's balloons aren't as far off the mark as I thought. A problem with them (for me) is there's no way to create them from Google Earth. Not much of a KML editing tool, Google Earth doesn't even let a user create "extended data", but it's ubiquitous. I am very much trying to avoid having to write a one-off visual editor for fuzzy and relative locations. I've got enough on my plate already and would like to find a fairly generic and declarative solution: location relativity expressed in markup, not written into a database using a specialized API or specialized GUI.

What to do? RDFa in Feature descriptions ala

<description><![CDATA[
This feature is somewhere within the
<a
  rel="where:within"
  href="http://sgillies.net/files/bagrid15.kml#batlas-15-b2-footprint;balloon">
footprint</a>
of
<a href="http://sgillies.net/files/bagrid15.kml#batlas-15-b2;balloon">
BA Grid 15 B2</a>.
]]></description>

is a possibility. Of course, you can't count on users to type RDFa and HTML properly (to change rel="where:within" to rel="where:outside" for example), so this opens a very large can of worms.

I'm going to continue to think aloud about this for a while. Good ideas and good-natured heckling are welcome.

Python and GeoJSON

GeoJSON is a browser-era alternative to the good old WKT format. It's not that {"type": "LineString", "coordinates": [[0.0, 0.0], [1.0, 0.0]]} is easier to parse than or technically superior to LINESTRING (0.0 0.0, 1.0 0.0), but that we can now represent geometric objects using a more general and widely used format: uniform use of JSON instead of WKT for geometry and some other format for non-geometric data.

On Seth G's geographika blog there's a fine demo of fetching GeoJSON from a web service and plotting it with matplotlib and descartes. Descartes deals in GeoJSON-like Python objects and so he could in fact keep the data in that form from start to finish.

This morning I found an email pointing out ArcPy's support for data interchange using the same kind of GeoJSON-like Python objects: AsShape().

import arcpy
gjPolygon = {
    "type": "Polygon",
    "coordinates":
        [[[10.0, 0.0], [20.0, 0.0], [20.0, 10.0], [10.0, 10.0], [10.0, 0.0]]]
    }
polygon = arcpy.AsShape(gjPolygon)

Is GeoJSON (as a dict) a new lingua franca for Python GIS? Will wider use mean that we'll finally have to do something about the GeoJSON specification's defficiencies at the date line and poles?

Comments

Re: Python and GeoJSON

Author: Howard Butler

WKT says nothing about datelines and poles. Additionally, there's nothing now from preventing a user to properly set and interpret their coordinate system and interpret the poles/datelines as they need right now.

Re: Python and GeoJSON

Author: Seth

I started using JSON because of MapFish and the ExtJS JavaScript Framework to pass tabular data between services and web applications, so GeoJSON seemed the obvious choice especially when OpenLayers has GeoJSON built in.

The main competitor to GeoJSON seems to be JSON..CloudMade serve out OpenStreetMap data in both formats - but with differing coordinate orders.

Are there any more GeoJSON services apart from those listed at http://wiki.geojson.org/Users ?

Re: Python and GeoJSON

Author: Sean

More services? Probably. As it is, Twitter is a service, not a server, and a big one (though with screwy coordinates). If all new GeoServer instances provide GeoJSON, that's a lot of services. GeoJSON is useful as a wire format, but it's also useful (IMO) as structure for passing data in Python.

GeoJSON is a bit geo-enterprisey: there are "geometries", "features", and "feature collections" all more or less in accord with the OGC feature model. OpenStreetMap has a different, graph-centric model and a different format makes sense.

Howard: I agree that the format doesn't get in the way of correct implementations.

Shapely 1.2

Shapely 1.2 source distribution and Windows installers for win32 and amd64 have been uploaded to http://pypi.python.org/pypi/Shapely and http://gispython.org/dist/. See the wiki for links to all the distributions.

To install and try it out (in a virtualenv):

$ pip install http://gispython.org/dist/Shapely-1.2.tar.gz

or

$ easy_install http://gispython.org/dist/Shapely-1.2.tar.gz

I always like to remind my readers that Shapely is a spin-off from a publicly-funded project. Major portions of this work were supported by a grant from the U.S. National Endowment for the Humanities (http://www.neh.gov). Factoring more widely useful packages out of our specialized ancient world studies application is part of our sustainability strategy. It pays off: most of the hard work toward 1.2 was done independently by Aron Bierbaum. I'm very pleased with the public/private interest collaboration we've got going on.

Share and enjoy.

Fuzzy or relative locations in KML?

We've got a lot of approximate, relative, and fuzzy places to deal with at work. I'm designing a hypermedia application to improve the coordinate and/or relativity precision of the place locations using KML. But how do we represent uncertain locations in KML? Previously, if a location was known to be in a lon/lat box I'd include that box as a polygon geometry. It sort of gets the point across, but the "within" relationship gets lost in the process. How do we express that a place is "within" or "near" another placemark? KML doesn't give us much to work with. A Feature can "have" a Geometry, but that's all the semantics we have. The upside of weak semantics is plenty of elbow room. In the absence of better patterns to follow, I'm considering something like this:

<?xml version="1.0" encoding="UTF-8"?>
<kml xmlns="http://www.opengis.net/kml/2.2"
  xmlns:atom="http://www.w3.org/2005/Atom">
<Document>
  <name>relative.kml</name>
  <open>1</open>
  <Style id="exampleStyleDocument">
    <LabelStyle>
      <color>ff0000cc</color>
    </LabelStyle>
    <BalloonStyle>
      <displayMode>default</displayMode>
    </BalloonStyle>
  </Style>

  <!-- a relative placemark -->
  <Placemark id="3">
    <name>Relative Feature 3</name>

    <!-- hypermedia in the user interface -->
    <description>
    <![CDATA[
    This feature is somewhere near
    <a href="http://sgillies.net/files/located.kml#2;balloon">
    feature 2 (located.kml#2)</a>.
    ]]>
    </description>

    <!-- a machine readable representation using a hypothetical
         link relation -->
    <atom:link rel="where:near" href="located.kml#2"/>

  </Placemark>

  <!-- located placemarks to provide context -->
  <NetworkLink>
    <name>located.kml</name>
    <Link>
      <href>http://sgillies.net/files/located.kml</href>
    </Link>
  </NetworkLink>

</Document>
</kml>

See for example: http://sgillies.net/files/relative.kml.

I'm interested to see how others are approaching this problem, but haven't seen any examples yet.

Update (2010-05-26): Turns out that it's just a quirk of Google Earth that you can get a popup bubble (hypermedia) for a placemark without a geometry. In Google Maps, an unlocated placemark does not surface at all. Back to the drawing board?

It seems that kml:address is KML's fuzzy counterpart to coordinates, but it's tied to particular, modern, geocoding database. I can express a location that is (at the center of) Arizona as <address>Arizona</address>, but I can't express a location like "between Arelate and Massalia" using kml:address.

Comments

Re: Fuzzy or relative locations in KML?

Author: Blair

As a spatial statistician, I deal with this problem in many contexts. Usually we use something like a probability distribution (see

a heat map

for example). Color denotes the probability of location. You can adjust the diameter of the "kernel"

kernel pic

to refelect the uncertainty (the variability). For example, if the context of "walking distance" was uncertain, you could have a diameter of the kernel in the 1-3km range, if it was in driving distance, you could have the diameter in the 1-100km range. That all assumes you have some context for "near".

Re: Fuzzy or relative locations in KML?

Author: sophia

KARML is a KML extension for Augmented Reality applications which has a notion of relative locations. For example this bit of KARML would place a balloon 2 meters north of the user.

<Placemark>
        <name>MyPlacemark</name>
        <description> My example placemark relative to user</description>
        <Balloon>
                <locationMode units=”meters” targetHRef=”#user”>relative</locationMode>
                <location>
                        <latitude>2.0</latitude>
                        <longitude>0.0</longitude>
                        <altitude>0.0</altitude>
                </location>
                <orientationMode>billboard</orientationMode>
        </Balloon>
</Placemark>

The spec is available here:

KARML

Re: Fuzzy or relative locations in KML?

Author: Sean

Measured locations (and all location is fuzzy when you get right down to it) could be well modeled like that, but I'm working with a different category of uncertainty. The location of a place that is "near the Nile", "within southwest Asia Minor", or "across the Aegean" isn't something to which you can apply the same statistics.

Re: Fuzzy or relative locations in KML?

Author: Tyler

In your example, what would be contained in your located.kml file? A placemark with a geometry element (i.e. kml:LineString for the Nile or a kml:Polygon for Asia Minor)?

WKT or GeoJSON uncertainty

Author: Kurt Schwehr

Even before the visual representation, how are you storing uncertainty in WKT or GeoJSON? This gets the extra complexity that uncertainty is usually not the same in all directions. For example in a bathymetric grid, we absolutely know x and y (to the limit of IEEE float limits) and then have an estimate for the Z based on measurements made from various instruments.

Re: Fuzzy or relative locations in KML?

Author: Sean

Kurt: I'm not talking about earth science type uncertainty at all, but the uncertainty or fuzziness in locations like the ones mentioned in Smith's "Dictionary of Greek and Roman Geography" (1854) [http://tinyurl.com/3ahxmaq]

For example:

"... Polybius places the Anamares in Gallia Transalpina near Massilia."

"The Boii occupied the country along the south side of the Po to the foot of the Apennines, and the northern slopes of these mountains."

We only know the location of these territories relative to other better-known locations. They can't be represented in WKT or GeoJSON at all. In our system, they are graphs: "A" "is near" "B" (etc). My question then is: how do we represent these graphs in KML without falsely attributing a precise location to anything? There will be some hackery, for sure. Google Earth (5) has some behavior that I like (mentioned above), but it's missing from Google Maps and probably from other KML applications as well.

I don't see how KARML's tours, billboards, and balloons will help.

Re: Fuzzy or relative locations in KML?

Author: Brandon Plewe

This is something I have thought about a lot. Unfortunately, Relative locations has received *very little* attention in GIScience research. I think it's because the applications that really need it (esp. history) aren't as common or as critical (or as well-funded) as most other GIS applications. You're right that a statistical error model (or fuzzy sets or whatever) is not appropriate here, because sometimes you know the measurement of the relationship very precisely. Then again, sometimes you don't ("near the Nile") and may need a combination of relative location and vagueness.

As far as data model goes, the approach I've used in the past is roughly the same as yours: create an arbitrary relationship between the two places that happens to be a spatial relationship. This makes the data model easy, but it leaves a lot of work for when you interpret the data (i.e., putting the places on a map).

By the way, I don't know to what kind of precision you're doing the dates in Pleiades, but the same issue arises temporally. For example, "Place X was founded in the 4th year of the reign of King Y," except we don't know exactly what years King Y reigned.

Spring snow

My family and I spent last weekend with a bunch of folks from Ruth's host lab in a gîte in the French Pyrénnées below the Cirque de Gavarnie [map]. It snowed enough to allow the kids to do a bit of sledding and construct some bonhommes de neige. Another product of the snowstorm was this titanic avalanche in the cirque.

http://farm5.static.flickr.com/4023/4611947451_d782cf3065_d.jpg

This photo was taken from the deck of the gîte. The rumble arrived a second or two after. I'd been shooting down the valley and missed the beginning of the slide. If it had occurred fifteen minutes earlier, I would have had a front row seat (sans camera); I had just returned from a run to the base of the cirque. I haven't seen reports of injuries, but the ascending hikers I passed on my way down must have had quite a shock.

A few minutes later there was a second smaller slide.

http://farm4.static.flickr.com/3412/4612006879_8e011f958e_d.jpg

Being an utterly amateur photographer, I muffed the exposure of these shots. Cascading snow clouds in flat light is probably a difficult subject even for the pros, eh? I did finally remember to flip the camera and zoom in a bit as the second slide poured into the bottom of the cirque.

http://farm4.static.flickr.com/3388/4612006927_6c3ca11c5f_d.jpg

That's more than one thousand meters from the starting zone to the base of the cirque. Kaboom!

We can't get enough of this region and are going to Pau in July to watch some stages of the Tour de France. 16 is the seventh Luchon-Pau stage, passing over the Cols de Peyresourde, Aspin, Tourmalet, and Aubisque. 17 is a return along the route to the 2nd ever finish at the Col du Tourmalet. To reach Gavarnie we traversed a stretch of the routes – the D921 between Argeles-Gazost and Luz-Saint-Saveur.

Comments

Re: Spring snow

Author: Mike

Stunningly beautiful! I've familiar with the summer appearance of the Pyrénnées (sadly only via television), from the Tour de France's annual visit. Stages 16 and 17 should prove wonderful to view in person.

Make your maps more visible

One of the things I like best about http://maps.google.com is that I can paste the URL of a GeoRSS feed or KML doc into the search form and get a map view of the data. I can also visualize that very same KML in other online mapping applications or desktop software like Google Earth (and why not GeoRSS too already?). I can email that KML link to someone else and they can also view the same data. KML is a general purpose interface layer for the kind of guerilla geospatial architecture I sketched a couple years ago.

http://sgillies.net/images/atom-guerrilla-soa.png

A property of this kind of architecture is visibility. You can "view source" to see the URL of the KML document this style of application is using and then fetch that same document to use in another way. Visibility is good for caching, good for scaling, good for monitoring, good for discovery. Good web apps, in my opinion, are characterized by high visibility.

The Google Maps API group has announced new KML and GeoRSS layers that improves the story for making visible map application with the Maps API. The design decisions are interesting, but I don't really want to get into them or start comparing them to OpenLayers; I just want to point out the API's support for visible architectures. A Google Map application's need for a highly specialized and opaque RPC interface to spatial data just shrank. Use KML or GeoRSS instead.

To get even more visibility you could link to KML from HTML instead of writing the KML URL into your javascript. My take on the Google example is below.

<html>
<head>
<title>Mapping linked KML</title>

<!-- Link to KML instead of writing into a script -->
<link
  type="application/vnd.google-earth.kml+xml"
  href="http://gmaps-samples.googlecode.com/svn/trunk/ggeoxml/cta.kml" />

<script
  type="text/javascript"
  src="http://maps.google.com/maps/api/js?sensor=false&amp;key="></script>

<!-- Now we have a more generic, reusable script -->
<script type="text/javascript" src="map.js"></script>

</head>
<body style="margin:0px; padding:0px;" onload="initialize()">
  <div id="map_canvas" style="width:100%; height:100%"></div>
</body>
</html>

Where map.js is

function getLinkedKML(doc) {
  var link = doc.evaluate(
    '//link[@type="application/vnd.google-earth.kml+xml"]',
    doc, null, XPathResult.FIRST_ORDERED_NODE_TYPE, null).singleNodeValue;

  return link.getAttribute("href");
}

function initialize() {
  var myOptions = {
    mapTypeId: google.maps.MapTypeId.ROADMAP
  };

  var map = new google.maps.Map(
    document.getElementById("map_canvas"),
    myOptions);

  var linkedKML = new google.maps.KmlLayer(getLinkedKML(document));

  linkedKML.setMap(map);
}

I've uploaded this to http://sgillies.net/files/linked-kml.html. Go ahead and view the source.

Comments

If i have two KML file

Author: jp

Hello,

I want to know if i have two KML file how may i include them( or to watch them).

example:http://myst/document/kml/kml1.kml and http://myst/document/kml/kml2.kml

to a same map.

Thanks

Re: Make your maps more visible

Author: Sean

The HTML doc can have any number of <link> to KML. In the case where neither of them have special semantics, you would get all KML link nodes instead of only the first (using the appropriate xpath expression and parameters) and then make a map layer of each.

Sorting features on spatial relations

I'm working on a map that shows all locations associated with an ancient place. The map is part of the HTML representation of the place (or more specifically: the resource that describes the place) and the data that goes into the map comes from a JSON representation of the place. I've written before about this hypertext-based design.

For this particular application, the ancient place is modeled as a GeoJSON feature collection and locations as GeoJSON features. A feature collection has a list of features and, GeoJSON being under-specified in comparison to other GIS standards, clients can't expect any particular ordering of the features. OpenLayers renders them in the order they are listed. We were running into trouble with feature collections that listed large feature patches after smaller feature patches or point features. The big features would be rendered last by OpenLayers and would pave over the smaller features, making it impossible to select them.

OpenLayers should continue to render features in the given order; predictable behavior is a very good thing. The answer, for us, is to get the features properly sorted in our JSON representation: a feature should be listed before the features it contains. Solved. We don't even need fancy geoprocessing to do it. This is easily accomplished using the sorting capability built into Python as sorted(), with a little help from Shapely.

Let's say we have 4 stereotypic features: a point that is contained by a polygon which is itself contained by another polygon, and a free spirited point contained by none.

>>> a = {'type': 'Point', 'coordinates': [2, 2]}
>>> b = {'type': 'Polygon', 'coordinates': [[[1, 1], [1, 3], [3, 3], [3, 1]]]}
>>> c = {'type': 'Polygon', 'coordinates': [[[0, 0], [0, 4], [4, 4], [4, 0]]]}
>>> d = {'type': 'Point', 'coordinates': [-1, -1]}

And that copies of these are collected into a list like

>>> features = [c, a, d, b, c]

Render this with OpenLayers and the big polygon (c) covers everything except point (d). Rendering them in reverse doesn't help because there's another big polygon at the other end of the list.

http://farm4.static.flickr.com/3327/4586542680_e3e0ba8d0e_d.jpg

Sorting using the default key (comparison by characters) seems to almost produce the right order for the map:

>>> from pprint import pprint
>>> pprint(sorted(features, reverse=True))
[{'type': 'Polygon', 'coordinates': [[[1, 1], [1, 3], [3, 3], [3, 1]]]},
 {'type': 'Polygon', 'coordinates': [[[0, 0], [0, 4], [4, 4], [4, 0]]]},
 {'type': 'Polygon', 'coordinates': [[[0, 0], [0, 4], [4, 4], [4, 0]]]},
 {'type': 'Point', 'coordinates': [2, 2]},
 {'type': 'Point', 'coordinates': [-1, -1]}]

The points are ordered after the polygons, which is good, but the bigger polygons still cover the contained one, not what we want. We'll need a different sorting key, one that considers whether features are spatially within another.

As explained in the Python Sorting HowTo, we can define a key function that operates on each list element and returns a value for comparison. Our key function will be a wrapper class that implements __lt__() using Shapely's binary within() predicate and asShape() adapter.

from shapely.geometry import asShape

class Within(object):
    def __init__(self, o):
        self.o = o
    def __lt__(self, other):
        return asShape(self.o).within(asShape(other.o))

As the howto says, the less than comparison is guaranteed to be used in sorting. That's what we'll rely on to spatially sort, and is why we're using within() in reverse instead of the contains() predicate. Trying it out on features b and c, we see that it works:

>>> b < c
False
>>> Within(b) < Within(c)
True

Now, the wrapper is used to sort by spatial containment like so

>>> pprint(sorted(features, key=Within, reverse=True))
[{'type': 'Point', 'coordinates': [-1, -1]},
 {'type': 'Polygon', 'coordinates': [[[0, 0], [0, 4], [4, 4], [4, 0]]]},
 {'type': 'Polygon', 'coordinates': [[[0, 0], [0, 4], [4, 4], [4, 0]]]},
 {'type': 'Polygon', 'coordinates': [[[1, 1], [1, 3], [3, 3], [3, 1]]]},
 {'type': 'Point', 'coordinates': [2, 2]}]

Voila: feature d is within no other feature and is listed first; the other features are listed as we wish. This little trick is now bound for the Shapely manual.

Comments

Re: Sorting features on spatial relations

Author: Tim Schaub

While this wouldn't provide a better solution than you've come up with, note that the graphicZIndex property of a symbolizer can be used to determine the z-ordering of features rendered by OpenLayers (for all feature types).

Relevant examples:

Re: Sorting features on spatial relations

Author: Sean

Thanks for the pointers, Tim, and for dealing with my crappy commenting system. Entering links is no fun here. Z level via styling is neat, but I think that in this particular case I'd still need to sort to produce an attribute that could be used in a styling rule, yes?

Re: Sorting features on spatial relations

Author: Vivien Deparday

Hi Sean,

I think you are right about producing an attribute to use in the styling rule.

I had a similar issue as you but I was using geoserver to produce the GeoJSON. So I used the graphicZIndez as mentionned by Tim but I had to add a rank field to my PostGIS table that I then used in the styling rule. I calculated the rank field based on the geometry type and the polygon areas, not as elegant as the within relationship.

It worked well but it is not ideal if the data is dynamic and I guess in this case a trigger would be needed to update the rank field so it is nice to see another solution.

Cheers

Re: Sorting features on spatial relations

Author: Tim Schaub

Right, to use rules you need an attribute, and you'd only be determining symbolizer properties based on a single feature at a time.

If it would work to determine z-index based on geometry type (point on top of polygon) and area (small polygon on top of big polygon), you could provide a custom "context" to an OpenLayers.Style object [1]. This is a bit forced, but your symbolizer zIndex property value could reference a function that returned an integer z-index based on geometry type and area (assuming you know the range of poly area).

Anyway, sorting on the server makes good sense (as long as you can). Another downside of the custom context function is that we don't serialize/deserialize this (if you ever need to persist your style).

[1] styles-context.html example

Re: Sorting features on spatial relations

Author: Sean

Indeed, ordering features by decreasing area would work equally well in my application since a feature can't completely pave over one with a larger area. I got caught up in the excitement of finding something that I could do easily with Python and can't do easily in a RDBMS with SQL. I wouldn't be surprised if it's possible to sort rows of a table based on mutual relationships, but I don't have that degree of SQL fu.

This post is really about a Python programming technique; OpenLayers is just the point of departure.

Descartes 1.0

Descartes is done. What's it for? Appealing precision plotting of polygons resulting from analysis of spatial data, holes and all. Examples of using it to produce figures for the Shapely manual are at http://github.com/sgillies/shapely/tree/master/docs/code/. The figures seem to be working:

Sean Gillies has just finished documenting the Shapely a “Python package for manipulation and analysis of planar geometries.”

The first impression you get is that its attractive. The images of geometry (generated by the Python package descartes) catch the eye, and it was these images as much as anything else that led me to trying Shapely in the first place.

That pleases me, though it's really matplotlib (and the Agg backend) that make the figures shine. Descartes just makes it simple to plug in GIS type data. The Shapely manual is not quite finished, but closer every day.

Related: Martin, I heart JTS too.

http://farm4.static.flickr.com/3209/4557432062_8ab0e41146_o_d.png

Comments

Re: Descartes 1.0

Author: Seth

The Shapely manual should definitely be added to this list:

http://sphinx.pocoo.org/examples.html

Do we also get to see donuts?