Descartes
Update (2010-04-10): http://pypi.python.org/pypi/descartes/0.1.2 adds support for GeoJSON-like objects and objects that provide the Python geo interface.
Update (2010-04-08): I've uploaded descartes 0.1, which now supports GeoJSON-like dicts (also known as "Python geo interface"), to http://pypi.python.org/pypi/descartes/0.1.
I've been making figures for the upcoming new version of the Shapely manual and developed some Shapely/matplotlib utility code that might be useful to others. The PolygonPatch class from descartes.patch takes care of all the fussy details of path creation, reducing the plotting of any polygon to a single line of code.
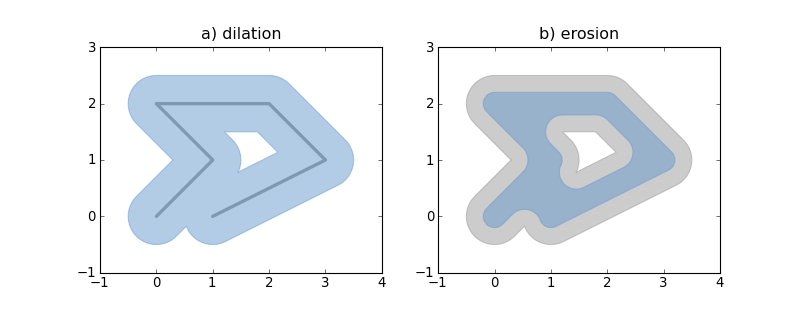
The plot on the left shows a line (grey) dilated to produce a polygon (blue). The plot on the right shows that same polygon (gray) eroded to produce a new polygon (blue).
from matplotlib import pyplot
from shapely.geometry import LineString
from descartes.patch import PolygonPatch

fig = pyplot.figure(1, figsize=(10, 4), dpi=180)

# Plot 1: dilating a line
line = LineString([(0, 0), (1, 1), (0, 2), (2, 2), (3, 1), (1, 0)])
ax = fig.add_subplot(121)
dilated = line.buffer(0.5)
patch1 = PolygonPatch(dilated, facecolor='#99ccff', edgecolor='#6699cc')
ax.add_patch(patch1)
x, y = line.xy
ax.plot(x, y, color='#999999')
ax.set_xlim(-1, 4)
ax.set_ylim(-1, 3)

# Plot 2: eroding the polygon from 1
ax = fig.add_subplot(122)
patch2a = PolygonPatch(dilated, facecolor='#cccccc', edgecolor='#999999')
ax.add_patch(patch2a)
eroded = dilated.buffer(-0.3)
patch2b = PolygonPatch(eroded, facecolor='#99ccff', edgecolor='#6699cc')
ax.add_patch(patch2b)
ax.set_xlim(-1, 4)
ax.set_ylim(-1, 3)

pyplot.show()
See http://bitbucket.org/sgillies/descartes/ for code and more examples.