Surely you've seen the Flickr shapefiles public dataset
and read Aaron Straup Cope's The Shape of Alpha about the why
and the how of making those shapes. For some time I've been thinking that we
could apply this kind of analysis to get a sense of the shape of fuzzy Pleiades
places like the Mare Erythraeum,
the territory of the Volcae Arecomici, or even Ptolemy's world. Not precise boundaries, which
are problematic in many ways, but shapes that permit reasonably accurate
queries for places bordering on the Volcae Arecomici or west of the Mare
Erythraeum.
The Mare Adriaticum is our current test bed in Pleiades. We've made 9 different
connections to it from precisely located islands, ports, and promontories.
These play the part of the tagged photos in the Flickr story, and here they are
as a GeoJSON feature collection:
https://gist.github.com/3886076#file_mare_adriaticum_connections.json. My alpha
shape analysis begins with a Delaunay triangulation of the space between these
points. I used scipy.spatial.Delaunay to do it and benefited from the
examples in this Stack Overflow post:
http://stackoverflow.com/questions/6537657/python-scipy-delaunay-plotting-point-cloud.
import json
import numpy as np
from scipy.spatial import Delaunay

# JSON data from the gist above.
coordinates = [f['geometry']['coordinates'] for f in json.loads(data)]
points = np.array(coordinates)
tri = Delaunay(np.array(points))

# Rest as in SO post above.
...
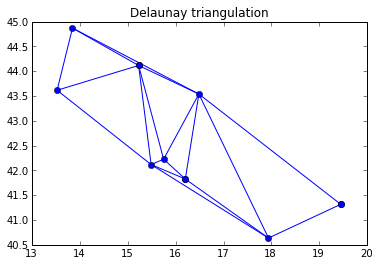
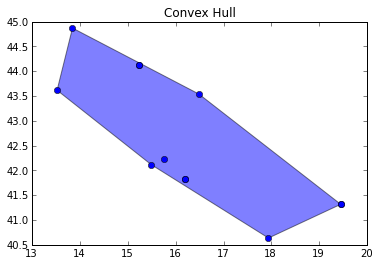
The nodes and lines of this triangulation are shown to the left below. Dissolving
them yields the convex hull of the points, a figure that is slightly too big
for Pleiades: points we want to have on the boundary of the Adriatic Sea, Iader
to the north and the tip of the Gargano Promontory to the sourth, fall inside
the hull. By what criteria might we toss out the peripheral triangles of which
they are nodes and obtain an alpha shape more representative of the
Adriatic? Printing out the radii of each triangle's circumcircle gives us this
list:
0.916234205371
21.0145482369
1.85517410861
1.79158041604
0.887999941617
0.983745009567
1.2507779965
1.01471746864
0.430582735954
6.79200819757
All of these are radii on the order of 1 except for 2 outliers. Those outliers are
the narrow triangles we want to exclude from our hull. Setting a radius limit
of 2 (α=0.5) via the code below removes the outlier triangles.
import math

edges = set()
edge_points = []
alpha = 0.5

# loop over triangles:
# ia, ib, ic = indices of corner points of the triangle
for ia, ib, ic in tri.vertices:
    pa = points[ia]
    pb = points[ib]
    pc = points[ic]

    # Lengths of sides of triangle
    a = math.sqrt((pa[0]-pb[0])**2 + (pa[1]-pb[1])**2)
    b = math.sqrt((pb[0]-pc[0])**2 + (pb[1]-pc[1])**2)
    c = math.sqrt((pc[0]-pa[0])**2 + (pc[1]-pa[1])**2)

    # Semiperimeter of triangle
    s = (a + b + c)/2.0

    # Area of triangle by Heron's formula
    area = math.sqrt(s*(s-a)*(s-b)*(s-c))

    circum_r = a*b*c/(4.0*area)

    # Here's the radius filter.
    if circum_r < 1.0/alpha:
        add_edge(ia, ib)
        add_edge(ib, ic)
        add_edge(ic, ia)

lines = LineCollection(edge_points)
plt.figure()
plt.title('Alpha=2.0 Delaunay triangulation')
plt.gca().add_collection(lines)
plt.plot(points[:,0], points[:,1], 'o', hold=1)
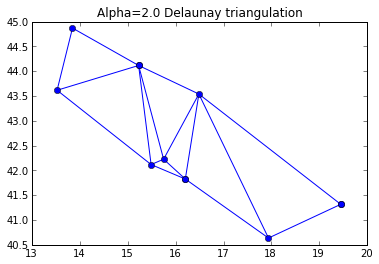
I dissolved the triangles using Shapely and render the hull using
PolygonPatch from descartes.
from descartes import PolygonPatch
from shapely.geometry import MultiLineString
from shapely.ops import cascaded_union, polygonize

m = MultiLineString(edge_points)
triangles = list(polygonize(m))

plt.figure()
plt.title("Alpha=2.0 Hull")
plt.gca().add_patch(PolygonPatch(cascaded_union(triangles), alpha=0.5))
plt.gca().autoscale(tight=False)
plt.plot(points[:,0], points[:,1], 'o', hold=1)
plt.show()
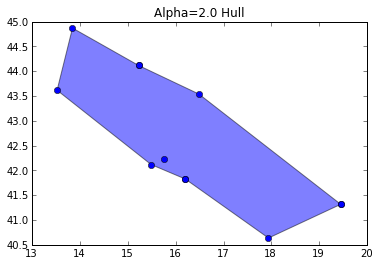
Can you see the difference? The hull pulls down a bit on the north edge and bumps
up a bit on the south edge. It may not look like much to you, but now we're rescuing the Gargano Massif from the Adriatic – a fascinating place with unique geologic formations and 3 species of native giant hamsters. Who knows how many or how large these may have been in ancient times? (Update 2012-10-15: It's unlikely that Romans encountered the giant hamsters and hedgehogs of Pliocene Gargano.)
I've put a lot of work into making Shapely play well with Numpy and Matplotlib
through the Python geospatial data protocol; it's fun to experiment with them like
this. That interface also makes publishing a web map of my alpha shape trivial. The
shape is exported to GeoJSON with a few lines of Python
from shapely.geometry import mapping

hull_layer = dict(
    type='FeatureCollection',
    features=[dict(
        type='Feature',
        id='1',
        title='Hull (Alpha=2.0)',
        description='See http://sgillies.net/blog/1154/the-fading-shape-of-alpha',
        geometry=mapping(cascaded_union(triangles)) )])

print json.dumps(hull_layer, indent=2)
and copied to a script in http://sgillies.github.com/mare-adriaticum to be
used with Leaflet. Leaflet! If the new OpenLayers is designed around first-class
treatment for GeoJSON we may yet return, but for now it's all Leaflet all the time
in Pleiades.
I've run out of time today for playing with and writing about ancient alpha
shapes, but have list of next things to do. It's obvious that I should be using
the Web Mercator projection at least and probably an equal area projection when
computing the circumcircles and triangulation and also obvious that there's no
globally ideal alpha value. A statistical analysis of the circumcircle radii
for each shape is certainly the right way to determine the outliers, and there
may be different kinds of distributions involved. Meanwhile, this alpha shape
of the Adriatic gets better as we anchor it to more precisely located places.
A few more at the north end and the resulting shape has bounding box and
centroid properties not much different than what you might come up with from an
Adriatic Sea shape derived from a world coastlines dataset.
Enumeration of the problems I see in asserting fine boundaries for unmeasurable or intrinsically fuzzy places is another TODO item.
(With apologies to Aaron Straup Cope for the title of this post.)


Comments
Re: C programming, Python programming
Author: Victor
But the magic really happens when you get rid of the take_tuples function:
Re: C programming, Python programming
Author: Sean
Victor, that's super cool. It benchmarks 30% faster than my C style code, and it easily extends to n-tuples (say I expected X,Y,Z triples) ala
coords = zip(*[latlons]*n) </pre> but I am swapping the order of lat and lon in take_tuples(), so zip() doesn't quite work.</p>
Re: C programming, Python programming
Author: Michal Migurski
Python does Numpy-style strides, so:
Re: C programming, Python programming
Author: Sean
Michal, that's even 1-2% faster than Victor's (my original benchmark was a linear ring with 64 vertices, approximating a circle, but difference is the same for 30 and 100 vertices). Even though slices copy data, they are apparently (at least with Python 2.7.3) a bit faster than iterators.
Re: C programming, Python programming
Author: John Drake
"Now, here's the icing: my new code (section 2 above, with map and list and the generator) benchmarks 10% faster than my old C style code. Binding the itr.next to a local variable (nxt) makes a big difference. I'm eating my cake and having it, too." That's really interesting, I wonder why it runs so much faster. It would seem that the opposite should be true.