Feed parsing and mapping
I've written that I was going to do something about the lack of GeoRSS support in feedparser. JSON seems to have eclipsed Atom and RSS at the cutting edge of things, but XML syndication formats remain a sound, minimally-coupled way to integrate systems on the web. The feedparser is still important to me and I want to see it have first-class spatial support. Today I tracked down the official GitHub repo of the current maintainer, forked it, and patched my old diff in, tests and all. The results are here: https://github.com/sgillies/feedparser/tree/georss.
Below is a bit of code that builds on my previous example of making Robinson
projection maps using Pyproj, matplotlib, and no for loops. There is
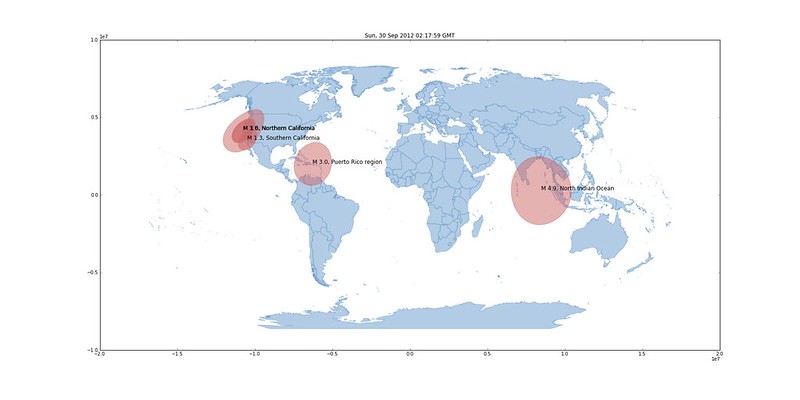
a function to make circular buffers around feed entry locations with a radius proportional to earthquake magnitude and one to label the locations. Each of these functions are simplified by the GeoJSON style property attached to entries by my feedparser patch. The feed I'm using is one of the last hour's quakes from the USGS.
from shapely.geometry import mapping, shape

feed = feedparser.parse(
    "http://earthquake.usgs.gov/earthquakes/catalogs/1hour-M1.xml")

def quake(entry):
    # entries have a ``where`` item that provides the Python geospatial
    # interface and can be operated on by geospatial packages
    title = entry.get('title', "M 0.0,")
    m, val = title.split(",")[0].split(" ")
    radius = 1.0 + 4.0*float(val)
    patch = shape(entry['where']).buffer(radius)
    return {"title": title, "geometry": mapping(patch)}

def label(fig, entry):
    x, y = transform_robin(*entry['where']['coordinates'])
    fig.gca().text(x, y, entry['title'], fontsize='large')
    return fig

quakes = imap(quake, filter(lambda x: x.get('where'), feed.entries))
fig = reduce(
        partial(add_record, fc=RED, ec=RED, alpha=0.5),
        imap(robinson, quakes),
        fig )
fig = reduce(
        label,
        filter(lambda x: x.get('where'), feed.entries),
        fig )
fig.gca().set_title(feed['updated'])
fig.savefig("quake.png")
The result is below. The circular buffers are not circles in the Robinson projection.
With my feedparser patch, GeoRSS feed entries become simple to operate on with Shapely, descartes, PySAL, ArcPy, or other software that understands the GeoJSON-like Python geospatial interface: https://gist.github.com/2217756. Please, like-minded people, leave a favourable comment at https://github.com/kurtmckee/feedparser/pull/9.