2009 (old posts, page 9)

Working and playing at CBGP

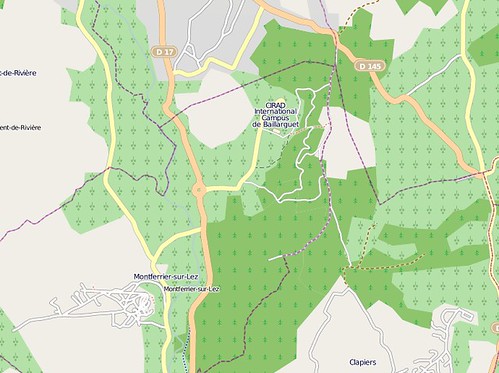
This fall I'm working in office space graciously provided by the Centre de Biologie et de Gestion des Populations at the CIRAD International Campus de Baillarguet outside Montferrier-sur-Lez [OpenStreetMap]. My wife is a visiting scientist here. I'm baggage, but extremely well-treated baggage. I share a corner office with a population geneticist who is waiting for his space in the new wing to be completed. There are bioinformatics programmers diving into Python next door. The internet mostly (c'est le Sud) works, and everybody is friendly and tolerant of my mediocre (terrible, really) French.

http://farm4.static.flickr.com/3519/4016516702_2c091dccb1_d.jpg

That's an image capture from 2009-10-16. Yes, I've heard about the OSM static map API, just waiting till it moves to what looks like a more permanent URL.

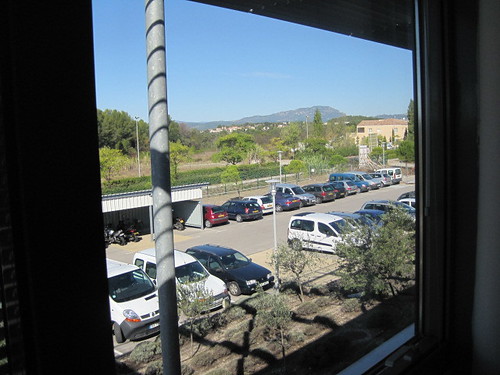
CBGP is out in the countryside north of the Montpellier metro. I've alluded to how pleasant it is out here and recently took a camera on my run to try to capture the feeling. Here's a view out of my office window of the parking lot and the Pic St-Loup hill to the north. One of my favorite local wineries is tucked under the cliffs on the other side of it.

http://farm4.static.flickr.com/3530/4015730981_588a03d008.jpg

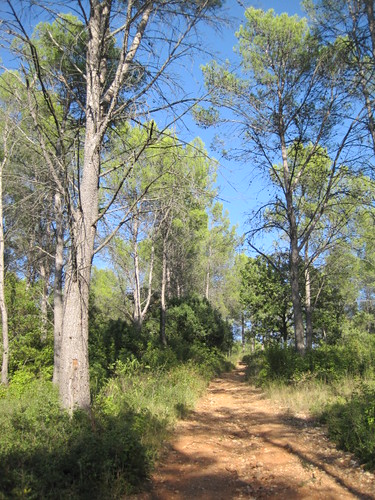
A semi-wild, wooded ridge runs for some kilometers to the east of CBGP. Here's the steep trail (which I've edited into OSM) up the hill from the back door of the Centre. I'm sorry that I can't identify the trees (update: there's a least two p. pinea, or stone pine, in the photo). There's an interesting mix, including what appear to be firs near the top. A little elevation makes a big difference around here.

http://farm3.static.flickr.com/2742/4015730985_8a5960e0fc.jpg

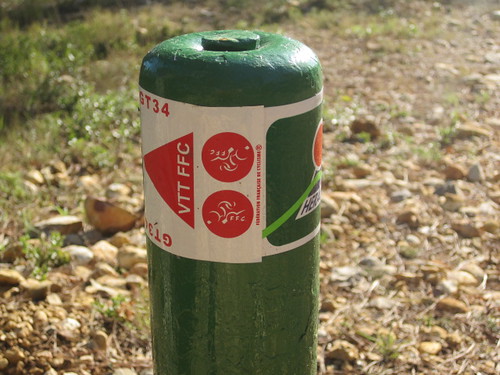
At the top of the ridge runs a national bike route. The markers look like this:

http://farm3.static.flickr.com/2502/4015730987_a9dcf3ac1e.jpg

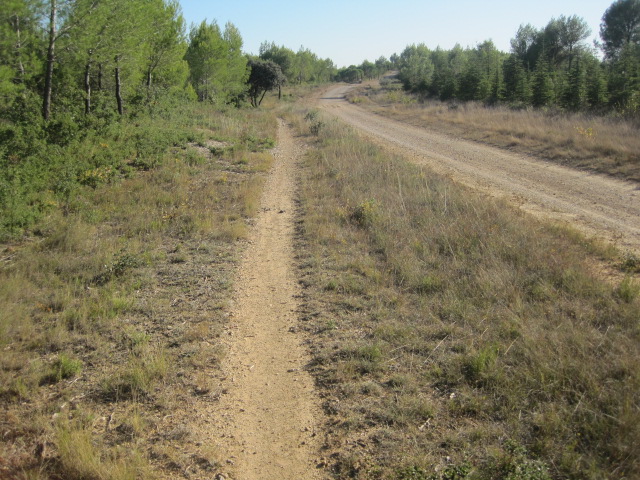
Single-track and fire road on the crest. Sometimes I forget I'm in France and feel like I'm back on the Front Range.

http://farm3.static.flickr.com/2562/4015730993_f8b3b7f187_o.jpg

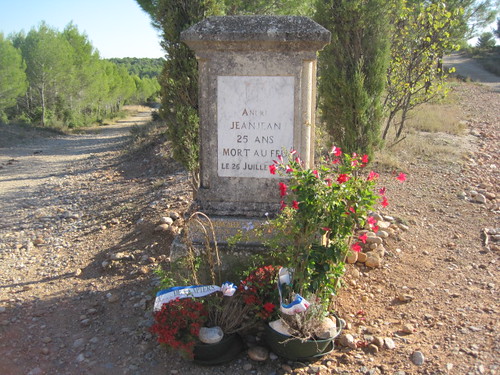
You may have noticed the group of identical conifers on the right side of the last photo. There was a 50 hectare fire here in 1981. André Jeanjean, A young volunteer sapeur-pompier, died fighting the blaze. I found fresh flowers from the Mairie of Clapiers at his memorial.

http://farm3.static.flickr.com/2705/4015730997_0694afe878.jpg

The left fork there runs down to a vineyard and on into Clapiers. I desperately need to acquire a mountain bike because CBGP is a great trailhead for some nice long rides.

Comments

Re: Working and playing at CBGP

Author: Paolo

Glad that you are enjoying Europe, Sean! ;-)

Shapely, map, and reduce

Not the Google MapReduce, that is, but Python's good old map() and reduce(). Waiting on something else this afternoon and just want to write this modestly neat code down for myself.

>>> from shapely.geometry import Point
>>> def union(a, b):
...     return a.union(b)
...
>>> print reduce(union, map(Point, zip(range(3), range(3)))).wkt
MULTIPOINT (0.0000000000000000 0.0000000000000000, 1.0000000000000000 1.0000000000000000, 2.0000000000000000 2.0000000000000000)

Update (2009-10-16): Could be made even shorter using lambda.

>>> from shapely.geometry import Point
>>> print reduce(lambda a, b: a.union(b), map(Point, zip(range(3), range(3)))).__geo_interface__
{'type': 'MultiPoint', 'coordinates': ((0.0, 0.0), (1.0, 1.0), (2.0, 2.0))}

Python and GIS 101

Reading that Chris Garrard was open to suggestions for improving her Geoprocessing with Python using Open Source GIS section at Utah State, the first thing that came to mind was that there could be a lesson on working with object-oriented and functional programming paradigms and how to take advantage of Python's support for each of them. Not just how to use instances, but how to write a useful class. How to use iterators and generators. A lesson about how to start to move from simple scripting, and the inevitable folders of replicating, mutating files named processing.py, processing2.py, processing2b.py, and so on (believe me, I've been there, only it was EASI scripts), to modules of reusable classes and functions. I've tried to come up with a simple example using the conventional GIS geometry model, something that will be familiar to a GIS analyst.

Actually, I wasn't considering functional programming at all when I started this, but it's obviously very helpful to a GIS programmer. All those nested loops one uses to loop over the elements of rasters? There's a Python function for that. This has been an exercise for me, too. I've found some recipes in Python's itertools module that I've overlooked for too long and are going to immediately improve a few of my own projects. For better or worse, Python lets you mix the object-oriented and functional paradigms, and I do that in the following walk-through of yet another Point class for Python.

The C or C++ library under your favorite Python bindings already provides a point class, so why reinvent the wheel? One day (I'm not predicting when) geometry and topology operation code written entirely in Python will execute quickly enough on enough different platforms to be ready for serious work. Imagine we're coding toward that future. In the meanwhile we'll see how to get more out of today's Python, and dabble in doctest, json, array, and itertools.

I've used Python 2.6 for this exercise, and nothing from outside the standard library. The source for the completed pygis_101 module is at http://bitbucket.org/sgillies/python-gis-101/src/.

Let's start with module containing a do-nothing Point class and a test runner.

# Module: pygis_101.py
# We'll stick to plane geometry

class Point(object):
    """The building block of higher dimensional geometries."""

# and introduce a doctest test runner to the end of the module

def _test():
    import doctest
    doctest.testmod()

if __name__ == "__main__":
    _test()

You can run all doctests in the module if you execute it as a script.

$ python pygis_101.py -v
3 items had no tests:
    __main__
    __main__.Point
    __main__._test
0 tests in 3 items.
0 passed and 0 failed.
Test passed.

Now, let's add a docstring with tests.

class Point(object):
    """The building block of higher dimensional geometries.

    This point class has 2 coordinates, which we'll call `x` and `y`:

        >>> point = Point(0.0, 0.0)
        >>> point.x
        0.0
        >>> point.y
        0.0
    """

Run the tests again

$ python pygis_101.py -v
Trying:
    point = Point(0.0, 0.0)
Expecting nothing
**********************************************************************
File "pygis_101.py", line 8, in __main__.Point
Failed example:
    point = Point(0.0, 0.0)
Exception raised:
    Traceback (most recent call last):
      File "/Users/seang/code/python-macosx/parts/opt/lib/python2.6/doctest.py", line 1231, in __run
        compileflags, 1) in test.globs
      File "<doctest __main__.Point[0]>", line 1, in <module>
        point = Point(0.0, 0.0)
    TypeError: object.__new__() takes no parameters
Trying:
    point.x
Expecting:
    0.0
**********************************************************************
File "pygis_101.py", line 9, in __main__.Point
Failed example:
    point.x
Exception raised:
    Traceback (most recent call last):
      File "/Users/seang/code/python-macosx/parts/opt/lib/python2.6/doctest.py", line 1231, in __run
        compileflags, 1) in test.globs
      File "<doctest __main__.Point[1]>", line 1, in <module>
        point.x
    NameError: name 'point' is not defined
Trying:
    point.y
Expecting:
    0.0
**********************************************************************
File "pygis_101.py", line 11, in __main__.Point
Failed example:
    point.y
Exception raised:
    Traceback (most recent call last):
      File "/Users/seang/code/python-macosx/parts/opt/lib/python2.6/doctest.py", line 1231, in __run
        compileflags, 1) in test.globs
      File "<doctest __main__.Point[2]>", line 1, in <module>
        point.y
    NameError: name 'point' is not defined
2 items had no tests:
    __main__
    __main__._test
**********************************************************************
1 items had failures:
   3 of   3 in __main__.Point
3 tests in 3 items.
0 passed and 3 failed.
***Test Failed*** 3 failures.

We'll need to override object.__init__() in order to pass in coordinate values when we create point instances. The values will be stored in instance attributes.

class Point(object):
    """The building block of higher dimensional geometries.

    This point class has 2 coordinates, which we'll call `x` and `y`:

        >>> point = Point(0.0, 0.0)
        >>> point.x
        0.0
        >>> point.y
        0.0
    """

    def __init__(self, x, y):
        self.x = x
        self.y = y

Now, the 3 tests pass

$ python pygis_101.py -v
Trying:
    point = Point(0.0, 0.0)
Expecting nothing
ok
Trying:
    point.x
Expecting:
    0.0
ok
Trying:
    point.y
Expecting:
    0.0
ok
3 items had no tests:
    __main__
    __main__.Point.__init__
    __main__._test
1 items passed all tests:
   3 tests in __main__.Point
3 tests in 4 items.
3 passed and 0 failed.
Test passed.

With that brief introduction to Python classes, test-driven development, and doctest finished, let's move on to making the Point class more useful.

Often, one wants to serialize geometries for use with other programs. One useful format is "well-known text", or "WKT". Let's add the following to the Point class:

def toWKT(self):
    """Returns a WKT representation of a point.

        >>> point = Point(0.0, 0.0)
        >>> print point.toWKT()
        POINT (0.000000 0.000000)
    """
    return 'POINT (%f %f)' % (self.x, self.y)

JSON is a rising format. Python and JSON go together like sausage and beer. You might be tempted to produce JSON by string interpolation, as we did for WKT, but it's best to use the json module included with Python 2.6, or simplejson installed separately for earlier Python versions. Don't forget to import json at the top of the module.

def toJSON(self):
    """Returns a GeoJSON representation of a point.

        >>> point = Point(0.0, 0.0)
        >>> print point.toJSON()
        {"type": "Point", "coordinates": [0.0, 0.0]}
    """
    return json.dumps(
        dict(type='Point', coordinates=(self.x, self.y))
        )

If we add a __geo_interface__ attribute (implemented as a property) that returns a dict like the one above, we could even use the point objects with the Shapely and GeoJSON packages.

@property
def __geo_interface__(self):
    """Returns a GeoJSON-ish dict representation of a point for interop
    with some other Python + GIS software.

        >>> point = Point(0.0, 0.0)
        >>> point.__geo_interface__
        {'type': 'Point', 'coordinates': (0.0, 0.0)}
    """
    return dict(type='Point', coordinates=(self.x, self.y))

def toJSON(self):
    """Returns a GeoJSON representation of a point.

        >>> point = Point(0.0, 0.0)
        >>> print point.toJSON()
        {"type": "Point", "coordinates": [0.0, 0.0]}
    """
    return json.dumps(self.__geo_interface__)

Now we've got 9 passing tests.

$ python pygis_101.py -v
...
4 items passed all tests:
   3 tests in __main__.Point
   2 tests in __main__.Point.__geo_interface__
   2 tests in __main__.Point.toJSON
   2 tests in __main__.Point.toWKT
9 tests in 7 items.
9 passed and 0 failed.
Test passed.

And, btw, 100% code coverage:

$ coverage run pygis_101.py
$ coverage report
Name        Stmts   Exec  Cover
-------------------------------
pygis_101      16     16   100%

A geometry object ought to be able to provide its bounding box. In order to show how to do this for many more kinds of geometries, let's rewrite Point's coordinate storage using arrays, replace the x and y attributes with dynamic properties for convenience, and add a move method for shifting the point to new coordinates. Then we get the bounding box by checking the minimum and maximum values of the coordinate arrays. This technique will work for just about any type of geometry. Use from array import array at the top, of course.

def __init__(self, x, y):
    self.xs = array('d')
    self.xs.append(x)
    self.ys = array('d')
    self.ys.append(y)

@property
def x(self):
    return self.xs[0]

@property
def y(self):
    return self.ys[0]

def move(self, x, y):
    """Move point to new coordinates x, y.

        >>> point = Point(0.0, 0.0)
        >>> point.move(1.0, 1.0)
        >>> point.x
        1.0
        >>> point.y
        1.0
    """
    self.xs[0] = x
    self.ys[0] = y

@property
def bounds(self):
    """Returns the bounding box as a (minx, miny, maxx, maxy) tuple.

        >>> point = Point(0.0, 0.0)
        >>> point.bounds
        (0.0, 0.0, 0.0, 0.0)
    """
    return min(self.xs), min(self.ys), max(self.xs), max(self.ys)

All production geometry-for-GIS software I know implements these kinds of coordinate sequences. To get coordinate pairs from the sequences, operate on the coordinate arrays with Python's built in zip method or itertools.izip, which I mention because the itertools documentation is a motherlode of fast and efficient iteration recipes.

>>> from array import array
>>> xs = array('d', [0.0, 1.0, 2.0])
>>> ys = array('d', [0.0, 1.0, 2.0])
>>> from itertools import izip, islice
>>> list(izip(xs, ys))
[(0.0, 0.0), (1.0, 1.0), (2.0, 2.0)]
>>> list(islice(izip(xs, ys), 1, None))
[(1.0, 1.0), (2.0, 2.0)]

Zip, btw, is its own inverse.

>>> zip(*zip([1,2,3], ['a', 'b', 'c']))
[(1, 2, 3), ('a', 'b', 'c')]

Going further, we can consolidate the toWKT and toJSON methods in a way that also works very efficiently for lines or paths (using list() instead of next() in that case):

@property
def coords(self):
    """Iterate over x,y pairs.

        >>> point = Point(0.0, 0.0)
        >>> next(point.coords)
        (0.0, 0.0)
    """
    return izip(self.xs, self.ys)

def toWKT(self):
    """Returns a WKT representation of a point.

        >>> point = Point(0.0, 0.0)
        >>> print point.toWKT()
        POINT (0.000000 0.000000)
    """
    return 'POINT (%f %f)' % next(self.coords)

@property
def __geo_interface__(self):
    """Returns a GeoJSON-ish dict representation of a point for interop
    with some other Python + GIS software.

        >>> point = Point(0.0, 0.0)
        >>> point.__geo_interface__
        {'type': 'Point', 'coordinates': (0.0, 0.0)}
    """
    return dict(type='Point', coordinates=next(self.coords))

Now we've got 17 passing tests and still 100% coverage.

$ coverage run pygis_101.py
$ coverage report
Name        Stmts   Exec  Cover
-------------------------------
pygis_101      31     31   100%

Next chance I get, I'll dig into some of my old blogged code to see what might be better done in a more functional style.
The HTML of the "GeoWeb"

HTML is the "HTML of the GeoWeb". From Mano Marks:

For a basic Google Maps mashup (or Bing, or Yahoo! Maps too), you need at least HTML, CSS, and JavaScript. More complicated mashups will use KML, GeoRSS, or GeoJSON, maybe Flash instead of JS, and wait. Notice the first one of those technologies, HTML. Still fundamentally, the GeoWeb relies on HTML. Sure, with a GeoWeb browser like Google Earth, you don't need HTML, though you can use it in the description balloons. But most mashups require HTML as the carrier.

Actually, you do still need HTML with Google Earth. Lacking forms or other intrinsic publishing mechanisms, KML is a format for read-only applications. Theoretically, one might put an HTML form in a placemark bubble and use that to modify the state of the resource behind the KML representation. Or javascript to modify the resource via XHR like many of us do with OpenLayers. Unfortunately, Google Earth doesn't surface forms in popups or fully support javascript. We'll have to wait for more convergence between Earth and Chrome, perhaps. Meanwhile, I'm making users hop between Earth and their browser. It's easy enough to cut and paste the placemark's KML text, but imagine what you could do with javascript and DOM-like access to the nodes in a KML doc.

Comments

Re: The HTML of the

Author: Brian Flood

hi sean

as of GE 5.0, you can use iFrames in the HTML balloons to get full access to the browser/DOM. it works well for editing data directly in the GE interface (even though its just a shortcut to what you're doing now)

cheers

brian

Re: The HTML of the

Author: Sean

Thanks for the tip, Brian. Better update, I guess, and get over the itchy feeling that iframes give me.

Re: The HTML of the

Author: Brian Flood

yea, wish I had better solution then iFrames. I remember there was some debate in the GE beta forums about native balloons supporting full html/js/flex and the outcome was a compromise using iFrames. the good part about it was at least you could rely on the balloon content acting in a well-known manner (caching, rendering, js issues etc) since its based on webkit (oddly enough, I think the embedded browser (below the globe) *may* use the machines default browser so you can end up with 2 different caches. go figure.)

in A2E, all the datasource feature resources have a small attribute editor built in that uses this technique for GE/GMaps (or anything really). the other cool part is since the iFrame is a real browser, all of your login/security goo works as it normally would

cheers

brian

Re: DOM-like access to the nodes in a KML doc

Author: Klokan Petr Pridal

Hi,

I just wanted to mention Google Earth API - where you have full access to the DOM of KML documents from JavaScript. Have a look at the documentation: http://code.google.com/apis/earth/articles/domintro.html.

and example of KML DOM manipulation via JavaScript:

http://earth-api-samples.googlecode.com/svn-history/r52/trunk/demos/dom-tree/index.html

Recently this was simplified by Roman Nurik (Google employee) via the Google Earth Utility Library (GEarthExtensions):

http://code.google.com/p/earth-api-utility-library/.

Of course, you need Google Earth Plugin for your web-browser - which is in this moment available for Windows and Mac (so no Linux yet :-().

Re: The HTML of the

Author: Sean

Right, this a good direction, but I can't tie my project to a proprietary plugin. And, again, this underlines how much we need HTML and javascript to complement KML.

Neo-paleo-geo

body_html_template

Comments

Re: Neo-paleo-geo

Author: darkblue_b

oh you've got this backwards... Its *not* geography, nor is it GIS, when you no longer need to measure in inches, nor be reference book correct. There is a new dimension emerging of spatially enabled data on the web, which may be usefully loose, or in aggregate only partially correct.

Yes, we do need new vocabulary amongst technical practitioners - all the more so since you just wrote this post...

Shapely 1.0.13 released

There's a testing bug fix in 1.0.13 and we've switched to prototyping libgeos_c functions in a way that lets Shapely function in py2exe apps. I've uploaded an sdist to http://pypi.python.org/pypi/Shapely/1.0.13. Windows installer yet to come.

Comments

Re: Shapely 1.0.13 released

Author: Brian Stankiewicz

Is there any ETA for releasing the Windows Installer? Simply installing (overwriting) the python code does not seem to fix the problem with py2exe (if it can could you describe how to do it please)?

Re: Shapely 1.0.13 released

Author: Sean

I can't recommend overwriting installed Python code, so you should hold off for a bit unless you're ready to wield the setup_windows.py script. Shapely's release process is a bit asynchronous, our Windows packaging expert is probably tied up with other stuff. He's had installers for previous releases within a few days.

Re: Shapely 1.0.13 released

Author: Brian Stankiewicz

Thanks for the update ... no, I have to admit that I am not "ready to wield the setup_windows.py script" ... or at least I can hold off for a couple of days. You're doing a great job. Thanks for all of the good work on this module!

Unofficial Python GIS SIG

There was a discussion on the GIS-Python list that made me think that there ought to be a discussion group that helps developers communicate across projects, share good ideas, and generally improve Python's GIS story, much like the Python Web-SIG list does for web software developers. Please help spread word of the Unofficial Python GIS SIG.

Comments

Re: Unofficial Python GIS SIG

Author: Timmie

It's a great idea!

I added this to the OSGEO wiki at

OSGeo Python Library

Will you advertise it on the mailing list of GRASS, QGIS, gvSIG, Mapfish, featureserver/tilecache?

Keep on!

Re: Unofficial Python GIS SIG

Author: Sean

I'm not a subscriber to those particular lists and am counting on others to spread the word. The MapFish developers are on board already.

Geography of dégustation: Saint-Christol

We're finally settled enough to resume our wine tourism. Pierre Boursot took me to visit Domaine de La Coste, an AOC Coteaux du Languedoc property near Saint-Christol on a Saturday evening. I've published a KML doc with a view that shows the domaine's larger North-facing slope. The wise say that Mourvèdre, in the Languedoc, should face the sea, and so it's planted on the opposite slope. To the West is planted Grenache. From the top of Luc and Elisabeth Moynier's Villafranchian limestone hill one has great views in all directions.

They make a number of great red wines from Grenache, Syrah, and Mourvèdre. I brought home some Cuvée Prestige (Mourvèdre, Grenache) and Cuvée Merlette ("forte dominance de Mourvèdre") for some midwinter roasts. Not shown on their website is a delicious vin blanc named Lou Camp de la Qualitat, a blend of Roussane and Viognier. Pierre tells me that such nice white wines are a rarity in a region that favors reds.

I'm a sucker for dessert wines, and so I knew I would be taking away some of the Muscat before I'd even tasted it. They also bottle an interesting aperitif from Mourvèdre juice called La Carthagène. It's like a vin santo, but pink-brown, more tannin and less caramel. I hear that there's a long tradition of idiosyncratic sweet wines in the Languedoc, definitely something I'm keen to explore.

The most curious part of the visit was when Luc Moynier offered us some wine fresh from the fermenter. The grapes had been picked 3 days before and subjected to carbonic maceration, a process in which whole grapes spontaneously ferment in an oxygen-free tank. It's more frothy fruit punch than wine at this early stage. Some of this character will remain in the finished wine, which winemakers used to enjoy right after the harvest (see Beaujolais nouveau). If I understood correctly, the Moyniers are experimenting with blending this into a new cuvée.

Eric Asimov recently wrote about wines of the Languedoc in The Languedoc Raises Its Game. It overlooks the Saint-Christol area in favor of more well-known and widely distributed wines from Minervois, Saint-Chinian, Faugères, and Pic St-Loup, but is well worth reading. Of the wines he reviews, I've tried the Domaine de l'Hortus, and it is indeed excellent. The vineyards and winery itself are also spectacularly well situated between rocky cliffs on the other side of the Pic Saint-Loup. That might have to be our next dégustation daytrip.