Putting it all together
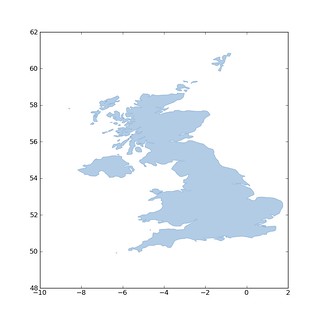
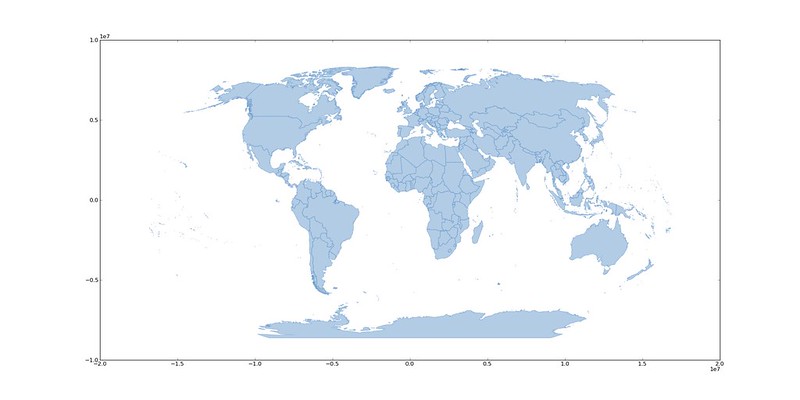
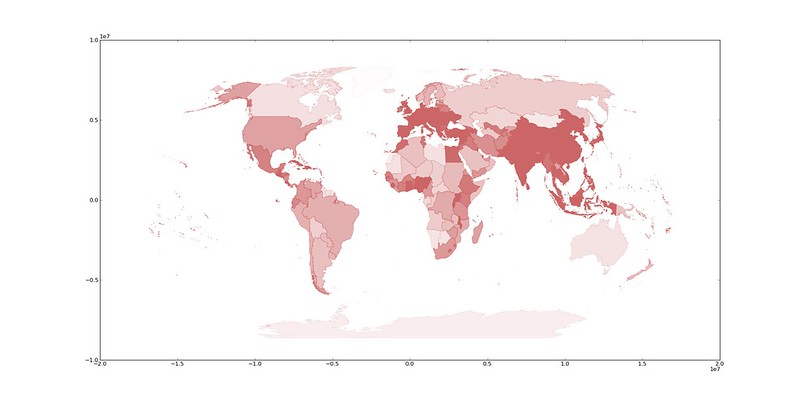
I'm continuing to have fun with functional style Python map hacking. I've blogged about different aspects of this, but here's my first try at putting it all together: data access to map projection to folding everything down into a map image. After writing three functions operating on single feature records (one for drawing, one for projection, one for weighting by attributes), I can get a basic choropleth map of world population density in 4 lines of Python. I'll introduce those functions one at a time starting with feature drawing.
Next, feature projection using Pyproj (and PROJ4).
Finally, classification of features by their attributes.
Code like zip(*func(*zip(*ring)) is probably taking it a little bit too far. While Python permits functional programming, its syntax isn't designed for readibility of functional code.
Update (2012-09-06): I've made 2 kinds of edits to the source in the gists. First, I've changed the drawing function so that it takes and returns a Matplotlib figure and noted why the function is impure. Mutability is essential to Matplotlib figures, there's no easy around this. The second bunch of edits restores as much referential transparency as I can: although the figures are mutable, they are only instantiated within the reduce expression and therefore can't be mutated by any other code.
Comments
Re: Putting it all together
Author: Admp
To embed the plot,ipython qtconsole pylab iialnelenve off the inline, and the plot pops up in a normal matplotlib window. Another nifty item, one can right click on a matplotlib plot window under KDE once you've got it sized and positioned on your screen, and (it's one reason I use kde over gnome)select Advanced-> Special Application Settings and then configure the window under the Size & Position tab to Apply Initially for both the Size and the Position ckeckboxes. From then on (till you change it similarly) matplotlib windows will open in the position and with the size you selected.
Re: Putting it all together
Author: Sean
Interesting... the comment above appears to have been ripped off from another matplotlib-related post: http://thomas-cokelaer.info/blog/2012/03/ipython/#comment-116. I've deleted the spammer's URL but left the comment.