2010 (old posts, page 5)

Shapely 1.2

Shapely 1.2 source distribution and Windows installers for win32 and amd64 have been uploaded to http://pypi.python.org/pypi/Shapely and http://gispython.org/dist/. See the wiki for links to all the distributions.

To install and try it out (in a virtualenv):

$ pip install http://gispython.org/dist/Shapely-1.2.tar.gz

or

$ easy_install http://gispython.org/dist/Shapely-1.2.tar.gz

I always like to remind my readers that Shapely is a spin-off from a publicly-funded project. Major portions of this work were supported by a grant from the U.S. National Endowment for the Humanities (http://www.neh.gov). Factoring more widely useful packages out of our specialized ancient world studies application is part of our sustainability strategy. It pays off: most of the hard work toward 1.2 was done independently by Aron Bierbaum. I'm very pleased with the public/private interest collaboration we've got going on.

Share and enjoy.

Fuzzy or relative locations in KML?

We've got a lot of approximate, relative, and fuzzy places to deal with at work. I'm designing a hypermedia application to improve the coordinate and/or relativity precision of the place locations using KML. But how do we represent uncertain locations in KML? Previously, if a location was known to be in a lon/lat box I'd include that box as a polygon geometry. It sort of gets the point across, but the "within" relationship gets lost in the process. How do we express that a place is "within" or "near" another placemark? KML doesn't give us much to work with. A Feature can "have" a Geometry, but that's all the semantics we have. The upside of weak semantics is plenty of elbow room. In the absence of better patterns to follow, I'm considering something like this:

<?xml version="1.0" encoding="UTF-8"?>
<kml xmlns="http://www.opengis.net/kml/2.2"
  xmlns:atom="http://www.w3.org/2005/Atom">
<Document>
  <name>relative.kml</name>
  <open>1</open>
  <Style id="exampleStyleDocument">
    <LabelStyle>
      <color>ff0000cc</color>
    </LabelStyle>
    <BalloonStyle>
      <displayMode>default</displayMode>
    </BalloonStyle>
  </Style>

  <!-- a relative placemark -->
  <Placemark id="3">
    <name>Relative Feature 3</name>

    <!-- hypermedia in the user interface -->
    <description>
    <![CDATA[
    This feature is somewhere near
    <a href="http://sgillies.net/files/located.kml#2;balloon">
    feature 2 (located.kml#2)</a>.
    ]]>
    </description>

    <!-- a machine readable representation using a hypothetical
         link relation -->
    <atom:link rel="where:near" href="located.kml#2"/>

  </Placemark>

  <!-- located placemarks to provide context -->
  <NetworkLink>
    <name>located.kml</name>
    <Link>
      <href>http://sgillies.net/files/located.kml</href>
    </Link>
  </NetworkLink>

</Document>
</kml>

See for example: http://sgillies.net/files/relative.kml.

I'm interested to see how others are approaching this problem, but haven't seen any examples yet.

Update (2010-05-26): Turns out that it's just a quirk of Google Earth that you can get a popup bubble (hypermedia) for a placemark without a geometry. In Google Maps, an unlocated placemark does not surface at all. Back to the drawing board?

It seems that kml:address is KML's fuzzy counterpart to coordinates, but it's tied to particular, modern, geocoding database. I can express a location that is (at the center of) Arizona as <address>Arizona</address>, but I can't express a location like "between Arelate and Massalia" using kml:address.

Comments

Re: Fuzzy or relative locations in KML?

Author: Blair

As a spatial statistician, I deal with this problem in many contexts. Usually we use something like a probability distribution (see

a heat map

for example). Color denotes the probability of location. You can adjust the diameter of the "kernel"

kernel pic

to refelect the uncertainty (the variability). For example, if the context of "walking distance" was uncertain, you could have a diameter of the kernel in the 1-3km range, if it was in driving distance, you could have the diameter in the 1-100km range. That all assumes you have some context for "near".

Re: Fuzzy or relative locations in KML?

Author: sophia

KARML is a KML extension for Augmented Reality applications which has a notion of relative locations. For example this bit of KARML would place a balloon 2 meters north of the user.

<Placemark>
        <name>MyPlacemark</name>
        <description> My example placemark relative to user</description>
        <Balloon>
                <locationMode units=”meters” targetHRef=”#user”>relative</locationMode>
                <location>
                        <latitude>2.0</latitude>
                        <longitude>0.0</longitude>
                        <altitude>0.0</altitude>
                </location>
                <orientationMode>billboard</orientationMode>
        </Balloon>
</Placemark>

The spec is available here:

KARML

Re: Fuzzy or relative locations in KML?

Author: Sean

Measured locations (and all location is fuzzy when you get right down to it) could be well modeled like that, but I'm working with a different category of uncertainty. The location of a place that is "near the Nile", "within southwest Asia Minor", or "across the Aegean" isn't something to which you can apply the same statistics.

Re: Fuzzy or relative locations in KML?

Author: Tyler

In your example, what would be contained in your located.kml file? A placemark with a geometry element (i.e. kml:LineString for the Nile or a kml:Polygon for Asia Minor)?

WKT or GeoJSON uncertainty

Author: Kurt Schwehr

Even before the visual representation, how are you storing uncertainty in WKT or GeoJSON? This gets the extra complexity that uncertainty is usually not the same in all directions. For example in a bathymetric grid, we absolutely know x and y (to the limit of IEEE float limits) and then have an estimate for the Z based on measurements made from various instruments.

Re: Fuzzy or relative locations in KML?

Author: Sean

Kurt: I'm not talking about earth science type uncertainty at all, but the uncertainty or fuzziness in locations like the ones mentioned in Smith's "Dictionary of Greek and Roman Geography" (1854) [http://tinyurl.com/3ahxmaq]

For example:

"... Polybius places the Anamares in Gallia Transalpina near Massilia."

"The Boii occupied the country along the south side of the Po to the foot of the Apennines, and the northern slopes of these mountains."

We only know the location of these territories relative to other better-known locations. They can't be represented in WKT or GeoJSON at all. In our system, they are graphs: "A" "is near" "B" (etc). My question then is: how do we represent these graphs in KML without falsely attributing a precise location to anything? There will be some hackery, for sure. Google Earth (5) has some behavior that I like (mentioned above), but it's missing from Google Maps and probably from other KML applications as well.

I don't see how KARML's tours, billboards, and balloons will help.

Re: Fuzzy or relative locations in KML?

Author: Brandon Plewe

This is something I have thought about a lot. Unfortunately, Relative locations has received *very little* attention in GIScience research. I think it's because the applications that really need it (esp. history) aren't as common or as critical (or as well-funded) as most other GIS applications. You're right that a statistical error model (or fuzzy sets or whatever) is not appropriate here, because sometimes you know the measurement of the relationship very precisely. Then again, sometimes you don't ("near the Nile") and may need a combination of relative location and vagueness.

As far as data model goes, the approach I've used in the past is roughly the same as yours: create an arbitrary relationship between the two places that happens to be a spatial relationship. This makes the data model easy, but it leaves a lot of work for when you interpret the data (i.e., putting the places on a map).

By the way, I don't know to what kind of precision you're doing the dates in Pleiades, but the same issue arises temporally. For example, "Place X was founded in the 4th year of the reign of King Y," except we don't know exactly what years King Y reigned.

Spring snow

My family and I spent last weekend with a bunch of folks from Ruth's host lab in a gîte in the French Pyrénnées below the Cirque de Gavarnie [map]. It snowed enough to allow the kids to do a bit of sledding and construct some bonhommes de neige. Another product of the snowstorm was this titanic avalanche in the cirque.

http://farm5.static.flickr.com/4023/4611947451_d782cf3065_d.jpg

This photo was taken from the deck of the gîte. The rumble arrived a second or two after. I'd been shooting down the valley and missed the beginning of the slide. If it had occurred fifteen minutes earlier, I would have had a front row seat (sans camera); I had just returned from a run to the base of the cirque. I haven't seen reports of injuries, but the ascending hikers I passed on my way down must have had quite a shock.

A few minutes later there was a second smaller slide.

http://farm4.static.flickr.com/3412/4612006879_8e011f958e_d.jpg

Being an utterly amateur photographer, I muffed the exposure of these shots. Cascading snow clouds in flat light is probably a difficult subject even for the pros, eh? I did finally remember to flip the camera and zoom in a bit as the second slide poured into the bottom of the cirque.

http://farm4.static.flickr.com/3388/4612006927_6c3ca11c5f_d.jpg

That's more than one thousand meters from the starting zone to the base of the cirque. Kaboom!

We can't get enough of this region and are going to Pau in July to watch some stages of the Tour de France. 16 is the seventh Luchon-Pau stage, passing over the Cols de Peyresourde, Aspin, Tourmalet, and Aubisque. 17 is a return along the route to the 2nd ever finish at the Col du Tourmalet. To reach Gavarnie we traversed a stretch of the routes – the D921 between Argeles-Gazost and Luz-Saint-Saveur.

Comments

Re: Spring snow

Author: Mike

Stunningly beautiful! I've familiar with the summer appearance of the Pyrénnées (sadly only via television), from the Tour de France's annual visit. Stages 16 and 17 should prove wonderful to view in person.

Make your maps more visible

One of the things I like best about http://maps.google.com is that I can paste the URL of a GeoRSS feed or KML doc into the search form and get a map view of the data. I can also visualize that very same KML in other online mapping applications or desktop software like Google Earth (and why not GeoRSS too already?). I can email that KML link to someone else and they can also view the same data. KML is a general purpose interface layer for the kind of guerilla geospatial architecture I sketched a couple years ago.

http://sgillies.net/images/atom-guerrilla-soa.png

A property of this kind of architecture is visibility. You can "view source" to see the URL of the KML document this style of application is using and then fetch that same document to use in another way. Visibility is good for caching, good for scaling, good for monitoring, good for discovery. Good web apps, in my opinion, are characterized by high visibility.

The Google Maps API group has announced new KML and GeoRSS layers that improves the story for making visible map application with the Maps API. The design decisions are interesting, but I don't really want to get into them or start comparing them to OpenLayers; I just want to point out the API's support for visible architectures. A Google Map application's need for a highly specialized and opaque RPC interface to spatial data just shrank. Use KML or GeoRSS instead.

To get even more visibility you could link to KML from HTML instead of writing the KML URL into your javascript. My take on the Google example is below.

<html>
<head>
<title>Mapping linked KML</title>

<!-- Link to KML instead of writing into a script -->
<link
  type="application/vnd.google-earth.kml+xml"
  href="http://gmaps-samples.googlecode.com/svn/trunk/ggeoxml/cta.kml" />

<script
  type="text/javascript"
  src="http://maps.google.com/maps/api/js?sensor=false&amp;key="></script>

<!-- Now we have a more generic, reusable script -->
<script type="text/javascript" src="map.js"></script>

</head>
<body style="margin:0px; padding:0px;" onload="initialize()">
  <div id="map_canvas" style="width:100%; height:100%"></div>
</body>
</html>

Where map.js is

function getLinkedKML(doc) {
  var link = doc.evaluate(
    '//link[@type="application/vnd.google-earth.kml+xml"]',
    doc, null, XPathResult.FIRST_ORDERED_NODE_TYPE, null).singleNodeValue;

  return link.getAttribute("href");
}

function initialize() {
  var myOptions = {
    mapTypeId: google.maps.MapTypeId.ROADMAP
  };

  var map = new google.maps.Map(
    document.getElementById("map_canvas"),
    myOptions);

  var linkedKML = new google.maps.KmlLayer(getLinkedKML(document));

  linkedKML.setMap(map);
}

I've uploaded this to http://sgillies.net/files/linked-kml.html. Go ahead and view the source.

Comments

If i have two KML file

Author: jp

Hello,

I want to know if i have two KML file how may i include them( or to watch them).

example:http://myst/document/kml/kml1.kml and http://myst/document/kml/kml2.kml

to a same map.

Thanks

Re: Make your maps more visible

Author: Sean

The HTML doc can have any number of <link> to KML. In the case where neither of them have special semantics, you would get all KML link nodes instead of only the first (using the appropriate xpath expression and parameters) and then make a map layer of each.

Sorting features on spatial relations

I'm working on a map that shows all locations associated with an ancient place. The map is part of the HTML representation of the place (or more specifically: the resource that describes the place) and the data that goes into the map comes from a JSON representation of the place. I've written before about this hypertext-based design.

For this particular application, the ancient place is modeled as a GeoJSON feature collection and locations as GeoJSON features. A feature collection has a list of features and, GeoJSON being under-specified in comparison to other GIS standards, clients can't expect any particular ordering of the features. OpenLayers renders them in the order they are listed. We were running into trouble with feature collections that listed large feature patches after smaller feature patches or point features. The big features would be rendered last by OpenLayers and would pave over the smaller features, making it impossible to select them.

OpenLayers should continue to render features in the given order; predictable behavior is a very good thing. The answer, for us, is to get the features properly sorted in our JSON representation: a feature should be listed before the features it contains. Solved. We don't even need fancy geoprocessing to do it. This is easily accomplished using the sorting capability built into Python as sorted(), with a little help from Shapely.

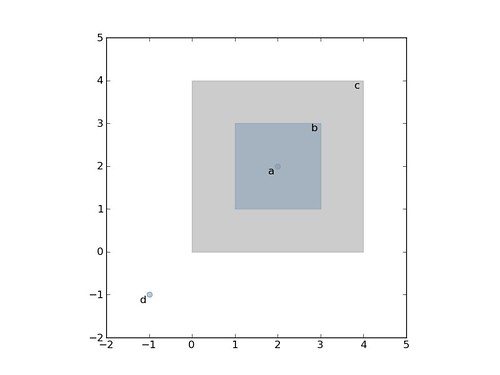
Let's say we have 4 stereotypic features: a point that is contained by a polygon which is itself contained by another polygon, and a free spirited point contained by none.

>>> a = {'type': 'Point', 'coordinates': [2, 2]}
>>> b = {'type': 'Polygon', 'coordinates': [[[1, 1], [1, 3], [3, 3], [3, 1]]]}
>>> c = {'type': 'Polygon', 'coordinates': [[[0, 0], [0, 4], [4, 4], [4, 0]]]}
>>> d = {'type': 'Point', 'coordinates': [-1, -1]}

And that copies of these are collected into a list like

>>> features = [c, a, d, b, c]

Render this with OpenLayers and the big polygon (c) covers everything except point (d). Rendering them in reverse doesn't help because there's another big polygon at the other end of the list.

http://farm4.static.flickr.com/3327/4586542680_e3e0ba8d0e_d.jpg

Sorting using the default key (comparison by characters) seems to almost produce the right order for the map:

>>> from pprint import pprint
>>> pprint(sorted(features, reverse=True))
[{'type': 'Polygon', 'coordinates': [[[1, 1], [1, 3], [3, 3], [3, 1]]]},
 {'type': 'Polygon', 'coordinates': [[[0, 0], [0, 4], [4, 4], [4, 0]]]},
 {'type': 'Polygon', 'coordinates': [[[0, 0], [0, 4], [4, 4], [4, 0]]]},
 {'type': 'Point', 'coordinates': [2, 2]},
 {'type': 'Point', 'coordinates': [-1, -1]}]

The points are ordered after the polygons, which is good, but the bigger polygons still cover the contained one, not what we want. We'll need a different sorting key, one that considers whether features are spatially within another.

As explained in the Python Sorting HowTo, we can define a key function that operates on each list element and returns a value for comparison. Our key function will be a wrapper class that implements __lt__() using Shapely's binary within() predicate and asShape() adapter.

from shapely.geometry import asShape

class Within(object):
    def __init__(self, o):
        self.o = o
    def __lt__(self, other):
        return asShape(self.o).within(asShape(other.o))

As the howto says, the less than comparison is guaranteed to be used in sorting. That's what we'll rely on to spatially sort, and is why we're using within() in reverse instead of the contains() predicate. Trying it out on features b and c, we see that it works:

>>> b < c
False
>>> Within(b) < Within(c)
True

Now, the wrapper is used to sort by spatial containment like so

>>> pprint(sorted(features, key=Within, reverse=True))
[{'type': 'Point', 'coordinates': [-1, -1]},
 {'type': 'Polygon', 'coordinates': [[[0, 0], [0, 4], [4, 4], [4, 0]]]},
 {'type': 'Polygon', 'coordinates': [[[0, 0], [0, 4], [4, 4], [4, 0]]]},
 {'type': 'Polygon', 'coordinates': [[[1, 1], [1, 3], [3, 3], [3, 1]]]},
 {'type': 'Point', 'coordinates': [2, 2]}]

Voila: feature d is within no other feature and is listed first; the other features are listed as we wish. This little trick is now bound for the Shapely manual.

Comments

Re: Sorting features on spatial relations

Author: Tim Schaub

While this wouldn't provide a better solution than you've come up with, note that the graphicZIndex property of a symbolizer can be used to determine the z-ordering of features rendered by OpenLayers (for all feature types).

Relevant examples:

Re: Sorting features on spatial relations

Author: Sean

Thanks for the pointers, Tim, and for dealing with my crappy commenting system. Entering links is no fun here. Z level via styling is neat, but I think that in this particular case I'd still need to sort to produce an attribute that could be used in a styling rule, yes?

Re: Sorting features on spatial relations

Author: Vivien Deparday

Hi Sean,

I think you are right about producing an attribute to use in the styling rule.

I had a similar issue as you but I was using geoserver to produce the GeoJSON. So I used the graphicZIndez as mentionned by Tim but I had to add a rank field to my PostGIS table that I then used in the styling rule. I calculated the rank field based on the geometry type and the polygon areas, not as elegant as the within relationship.

It worked well but it is not ideal if the data is dynamic and I guess in this case a trigger would be needed to update the rank field so it is nice to see another solution.

Cheers

Re: Sorting features on spatial relations

Author: Tim Schaub

Right, to use rules you need an attribute, and you'd only be determining symbolizer properties based on a single feature at a time.

If it would work to determine z-index based on geometry type (point on top of polygon) and area (small polygon on top of big polygon), you could provide a custom "context" to an OpenLayers.Style object [1]. This is a bit forced, but your symbolizer zIndex property value could reference a function that returned an integer z-index based on geometry type and area (assuming you know the range of poly area).

Anyway, sorting on the server makes good sense (as long as you can). Another downside of the custom context function is that we don't serialize/deserialize this (if you ever need to persist your style).

[1] styles-context.html example

Re: Sorting features on spatial relations

Author: Sean

Indeed, ordering features by decreasing area would work equally well in my application since a feature can't completely pave over one with a larger area. I got caught up in the excitement of finding something that I could do easily with Python and can't do easily in a RDBMS with SQL. I wouldn't be surprised if it's possible to sort rows of a table based on mutual relationships, but I don't have that degree of SQL fu.

This post is really about a Python programming technique; OpenLayers is just the point of departure.

Descartes 1.0

Descartes is done. What's it for? Appealing precision plotting of polygons resulting from analysis of spatial data, holes and all. Examples of using it to produce figures for the Shapely manual are at http://github.com/sgillies/shapely/tree/master/docs/code/. The figures seem to be working:

Sean Gillies has just finished documenting the Shapely a “Python package for manipulation and analysis of planar geometries.”

The first impression you get is that its attractive. The images of geometry (generated by the Python package descartes) catch the eye, and it was these images as much as anything else that led me to trying Shapely in the first place.

That pleases me, though it's really matplotlib (and the Agg backend) that make the figures shine. Descartes just makes it simple to plug in GIS type data. The Shapely manual is not quite finished, but closer every day.

Related: Martin, I heart JTS too.

http://farm4.static.flickr.com/3209/4557432062_8ab0e41146_o_d.png

Comments

Re: Descartes 1.0

Author: Seth

The Shapely manual should definitely be added to this list:

http://sphinx.pocoo.org/examples.html

Do we also get to see donuts?

No end-points

Subbu Allamaraju on the Facebook Graph API and links

It is interconnected as every representation is linked to related resources. For instance, an album representation is linked to the profile that posted the album. Each user representation is linked to a collection of groups that the user is member of. This is hypermedia in action. Hypermedia does not have to be complicated – and Facebook just proves it.

Geo-annotating tweets

Twitter annotations seem to make some great new location applications possible. Agree on a key, use a URI that resolves to a map or KML as a value, and you're on the map.

annotations: [
  {key: "where", value: "http://www.geonames.org/2992166/montpellier.html"}
]

Comments

Re: Geo-annotating tweets

Author: Alex

I have two (completely different) suggestions for this:

For one, i've created a URI scheme named "geo:" with a friend of mine - it's currently going through IETF standardization, and will be a Standards Track RFC soon: http://datatracker.ietf.org/doc/draft-ietf-geopriv-geo-uri/ - The nice thing about "geo" URIs is that they are independent of any web mapping service - the URI itself contains the coordinates. Given that this is going to be an RFC soon, it should be supported quite broadly - Android phones do already support such addresses!

Second, i'm running a short URL service at http://xm.my/ specifically for creating short links for maps. Space might not be a problem in Tweet Annotations, but it's still useful to have very short links for map services if you want to include the link in the Tweet itself. An example of such a map is http://xm.my/sjGQ

Alex

Re: Geo-annotating tweets

Author: Sean

I prefer http: URIs because they leverage all of HTTP and the web and aren't limited to single points on the globe. They're useful for identifying complex features that would overflow conventional limits on URI length and for identifying "fuzzy" or fictional places.

Geographic OData

I've been slow to catch up with Microsoft's OData initiative, but saw a link to geographic OData in the blog of Michael Hausenblas: Edmonton bus stops.

It's an Atom feed with extensions, including location,

<content type="application/xml">
  <m:properties>
    <d:PartitionKey>1000</d:PartitionKey>
    <d:RowKey>3b57b81c-8a36-4eb7-ac7f-31163abf1737</d:RowKey>
    <d:Timestamp m:type="Edm.DateTime">2010-01-14T22:43:35.7527659Z</d:Timestamp>
    <d:entityid m:type="Edm.Guid">b0d9924a-8875-42c4-9b1c-246e9f5c8e49</d:entityid>
    <d:stop_number>1000</d:stop_number>
    <d:street>Abbottsfield</d:street>
    <d:avenue>Transit Centre</d:avenue>
    <d:region>Edmonton</d:region>
    <d:latitude m:type="Edm.Double">53.57196999</d:latitude>
    <d:longitude m:type="Edm.Double">-113.3901687</d:longitude>
    <d:elevation m:type="Edm.Double">0</d:elevation>

  </m:properties>
</content>

but the location is tied up inside an OData payload. A GeoRSS processor (such as GMaps) has no clue [map].

Pleiades is also taking an Atom-based approach to data, but does use GeoRSS. There were no bus stops back in the day, but there were bridges [map].

Comments on Michael's blog post indicate that OData is designed around "rectangular" rather than "linked" data. Atom as an envelope for tabular, CSV-like, data (like KML's extended data). Atom's content element was designed to accomodate this, but it seems clear to me that data, especially standard stuff like geographic location, is more visible outside the payload.