Pruning CRS from GeoJSON

I uploaded version 4 of the GeoJSON I-D to the IETF's tracker yesterday. It contains a major change to section 3. In version 3, the draft contained more or less the same text as in http://geojson.org/geojson-spec.html, but version 4 declares that coordinate reference systems other than the default are not recommended and that means of describing them, including the CRS object of the original 2008 spec, are now application specific concerns. In other words, if you want projected coordinates in the GeoJSON that travels between the front and back ends of your web app you're on your own. Furthermore, you're doing it wrong if you publish this projected GeoJSON to the open web and expect processors to have access to an EPSG database.

I've been watching the IETF JSON Working Group's JSON, I-JSON, and JSON Sequence discussions closely while revising the GeoJSON I-D. Version 4 treats CRS like RFC 7159 treats character encoding, acknowledging other coordinate reference systems while making a very strong recommendation for using the default CRS. You could say CRS84 is our UTF-8. Version 4 also requires that coordinates not be ordered latitude, longitude. Lat/lng is like our byte order mark.

Removing the CRS object description from the draft has been a goal of mine from the start. Its poor design has been a distraction and it never was as useful to developers as we intended. The GeoJSON draft is better without it. I get the impression that some standards people will see its removal from the draft as a void to be filled. CRS wonks gotta wonk, I suppose, but do developers care very much that there is no JSON equivalent of <gml:ProjectedCRS>? I don't think so.

SciPy Conference

I'm back from my first ever trip to SciPy, the annual scientific Python community conference. I found it quite amazingly good.

https://conference.scipy.org/scipy2014/site_media/static/img/scipy2014_logo_simple.png

Slides from my talk on Wednesday are at https://sgillies.github.io/scipy-2014-rasterio/. I feel like it went well and hope that you found (and will find it) useful, too. I missed Tuesday's sessions, which were jam packed with geospatial talks, and didn't have time to check out all the slides from those before presenting. Referencing other talks is something I usually try to do, and failing to do so felt a little weird. My talk was sandwiched between Tyler Erickson's on Google Earth Engine and Shawn Walbridge's on workflows and distribution of GIS Science toolkits; a nice showing of research and science going on at Google, Mapbox, and Esri.

The IPython Notebook seemed to be the major touchstone for presenters and other attendees of the conference, and rightly so. I've got all kinds of plans for doing things with it, many that I expressed at the conference, and I'm certain that it's going to spread in GIS circles. Features coming soon to notebooks near you include: map interactivity, Native Client notebooks, Google Drive hosted notebooks, and a new language agnostic platform. I enjoyed getting to meet Fernando Perez and Brian Granger and congratulate them on the success of the project.

Greg Wilson's keynote, available on Youtube, was a challenge to apply science to the teaching of programming and other subjects. I definitely recommend watching it. A strange recommendation from me, I know, since I'm more likely to say things like "keynotes are terrible." Keynotes that stroke the audience are terrible. Wilson's is better than that.

Best part of the trip for me was sprinting on GeoPandas and other projects with Kelsey Jordahl, Nora Deram, Jacob Wasserman (remotely), Matt Perry, Taylor Oshan, Carson Farmer, Shawn Walbridge, Serge Ray, and Philip Stephens. I learned a ton about Pandas and GeoPandas, made some solid contributions to the project, and all in great company. It was a pleasure and a privilege.

One sobering thing is being reminded that not everyone enjoys the same pleasure and privilege. It's important to read and think about April Wright's thoughts on SciPy: http://wrightaprilm.github.io/posts/lonely.html.

Steady as she goes

Standards organizations are increasingly interested in the little format that could and if http://www.w3.org/2014/05/geo-charter is any indication it's likely that you'll be seeing more mention of GeoJSON and GeoJSON-LD in OGC and W3C materials soon. However, the GeoJSON working group (for which I'm speaking in just this and the following sentence), is going to keep its own independent course. Work on the GeoJSON Internet Draft will continue to be done at https://github.com/geojson/draft-geojson and on the GeoJSON discussion list.

Now, Mapbox has recently joined the OGC and I've subsequently received emails from OGC members seeking discussion of GeoJSON. This is exactly the thing that I want to avoid and I will decline to do so outside of the GeoJSON venues I listed above. I hope you will, too, because discussions of GeoJSON on closed OGC technical committee lists or private emails with other OGC members aren't going to do the GeoJSON format, I-D, or users any good. GeoJSON is for the open web. Let's continue to tend it on the open web.

The GeoJSON media type

It's official: application/vnd.geo+json is the media type for GeoJSON registered with the IANA. I had been holding out for a profile of application/json, but it seems that the internet has resigned itself to a Cambrian explosion of JSON media types.

Start serving your GeoJSON up with the new content type

HTTP/1.1 200 OK
Content-Type: application/vnd.geo+json

and start asking for it by name.

Accept: application/vnd.geo+json; q=1.0, application/json; q=0.5

Update (2019-11-13): Since the publication of RFC 7946 GeoJSON has a new official media type, application/geo+json.

The GeoJSON-LD project

JSON-LD is JSON for linking data and it's a web standard: http://json-ld.org/. It offers a smooth, even zero-edit in some cases, path for upgrading existing GeoJSON data and makes web-friendly extension of GeoJSON possible.

Previously, if you added a "timestamp": "2014-03-27" to a GeoJSON feature object's "properties", a user has to guess what you mean. Playing guessing games with my kids is fun. Playing pointless guessing games with data sucks. One of the most important things JSON-LD offers is a framework in which you can unambiguously identify "timestamp" as "http://purl.org/dc/terms/created". Now users of your data have a solid start toward understanding what you mean by "timestamp".

There's more to JSON-LD than defining your feature properties. You can also bring in terms from other vocabularies to express that your features are, say, schema.org AdministrativeAreas or Landforms.

If you'd like to help shape the way we use GeoJSON in the future, please follow https://github.com/geojson/geojson-ld and jump into discussion on the open vocabulary and context issues.

Warping images with rasterio

Warping imagery from one spatial basis to another is a crucial function. I've been determined that rasterio be able to do this. Scipy provides a geometric_transform() function that I like, but I'd like rasterio to operate at a higher level and take advantage of GDAL's fast transformers. GDAL's gdalwarp program only operates on files, and I'm aiming lower than this (so rasterio can let us build better scripts). The ReprojectImage() function in osgeo.gdal, as pointed out in http://jgomezdans.github.io/gdal_notes/reprojection.html, only works on GDAL dataset objects. And the code to make them gets messy.

My requirements for a rasterio warper are:

  • Speed approaching gdalwarp.

  • Same results (same algorithms) as gdalwarp.

  • Sources and destinations can be ndarrays as well as bands in files.

  • Simplicity and clarity.

I think I've managed to satisfy these requirements. The warp module will be the key feature of the next rasterio release.

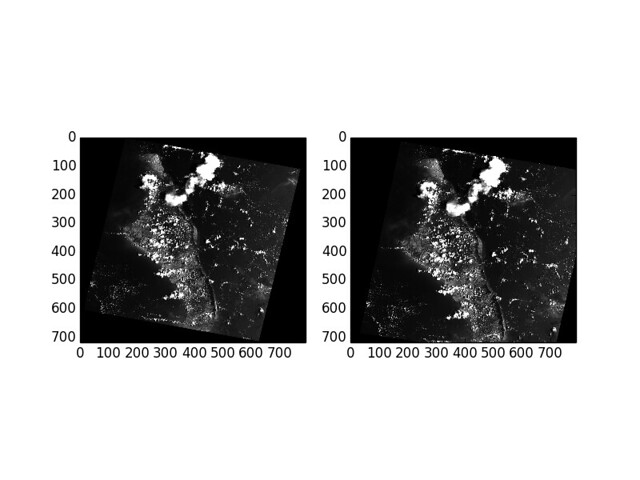
Here's an example within the interactive dataset inspector.

$ rasterio.insp rasterio/tests/data/RGB.byte.tif
Rasterio 0.7 Interactive Inspector (Python 2.7.5)
Type "src.name", "src.read_band(1)", or "help(src)" for more information.

The reproject() function takes source and destination ndarrays and an affine transformation vector and coordinate reference system for each. In this example, I'm warping the UTM source to a Web Mercator destination of slightly smaller extent. I computed the extents of the destination using pyplot, rasterio has yet no method to come up with an optimal destination extent (to do).

>>> source = src.read_band(1)
>>> dst_transform = [
...     -8789636.708,
...     300.0,
...     0.0,
...     2943560.235,
...     0.0,
...     -300.0]
>>> dst_crs = {'init': 'EPSG:3857'}
>>> destin = np.empty(src.shape, dtype=np.uint8)
>>> from rasterio import _warp
>>> _warp.reproject(
...     source, destin,
...     src.transform, src.crs,
...     dst_transform, dst_crs)
>>> import matplotlib.pyplot as plt
>>> plt.subplot(121)
<matplotlib.axes.AxesSubplot object at 0x1075362d0>
>>> plt.imshow(source)
<matplotlib.image.AxesImage object at 0x1078b1450>
>>> plt.gray()
>>> plt.subplot(122)
<matplotlib.axes.AxesSubplot object at 0x1075ffe50>
>>> plt.imshow(destin)
<matplotlib.image.AxesImage object at 0x1078b19d0>
>>> plt.gray()
>>> plt.savefig('/tmp/warp.png')

It's pretty much just three statements. One to get a source ndarray from a dataset. One to create a destination ndarray. One to call reproject().

I'm out of time to properly transform the axes in the plots to show coordinates in their proper CRS, but they're warped correctly.

http://farm4.staticflickr.com/3776/12773733534_c51761076e_z_d.jpg

Rasterio cookbook recipe number one

I got a nice message today from a developer who found rasterio to be the right tool for scaling the values of a 15 GB LiDAR DEM. Here's the code.

import numpy as np
import rasterio

"""
2014-02-13
Bryan Luman
Use it however you like at your own risk

Problem:
I have a huge DEM converted from LiDAR LAS points. I'd like to make
it slightly less massive for further processing.

All my z values are between 682 and 869 feet stored as float32. If
I convert them to centimeters and they will fit well within a 16 bit
unsigned integer.

This saves a significant amount of storage space and greatly reduces
any type of future analysis.

"""

CM_IN_FOOT = 30.48

with rasterio.drivers():
    with rasterio.open('massive_dem_as_float') as src:
        kwargs = src.meta
        kwargs.update(
            driver='GTiff',
            dtype=rasterio.uint16,
            count=1,
            compress='lzw',
            nodata=0,
            bigtiff='YES' # Output will be larger than 4GB
        )

        windows = src.block_windows(1)

        with rasterio.open(
                'less_massive_dem_with_as_int.tif',
                'w',
                **kwargs) as dst:
            for idx, window in windows:
                src_data = src.read_band(1, window=window)

                # Source nodata value is a very small negative number
                # Converting in to zero for the output raster
                np.putmask(src_data, src_data < 0, 0)

                dst_data = (src_data * CM_IN_FOOT).astype(rasterio.uint16)
                dst.write_band(1, dst_data, window=window)

This uses the windowed read and write and windows iterator features of rasterio that I worked on with Asger Skovbo Petersen.

Do you have any more short rasterio code examples? I'd love to start collecting these into a cookbook of sorts.

Fiona 1.1.1, rasterio 0.5.1

I released Fiona 1.1.1 and rasterio 0.5.1 yesterday. There are a couple bug fixes, but the main features are the interactive data inspectors fiona.insp

$ fiona.insp docs/data/test_uk.shp
Fiona 1.1.1 Interactive Inspector (Python 2.7.5)
Type "src.schema", "next(src)", or "help(src)" for more information.
>>>

and rasterio.insp.

$ rasterio.insp rasterio/tests/data/RGB.byte.tif
Rasterio 0.5.1 Interactive Inspector (Python 2.7.5)
Type "src.name", "src.read_band(1)", or "help(src)" for more information.
>>>

Interactive interpreters for Fiona and Rasterio

I'm not sure why I didn't think of this before, but last night after the nth time launching python in interactive mode, importing rasterio, and typing in a filename with no tab completion, I made myself an interactive raster dataset inspector for Rasterio. Oh, and yes, I made it for you, too. Then I made one for Fiona.

You've used Python's interpreter interactively before, yes? By which I mean typing "python" at a shell prompt to get the banner and triple right-angle bracket prompt.

$ python
Python 2.7.5 (default, Oct  3 2013, 20:27:52)
[GCC 4.2.1 Compatible Apple LLVM 5.0 (clang-500.2.76)] on darwin
Type "help", "copyright", "credits" or "license" for more information.
>>>

I've used code.interact() to give you the same kind of prompt right after calling rasterio.open() on a filename you provide to the main function in rasterio.tool(). The code is ridiculously simple.

$ python -m rasterio.tool rasterio/tests/data/RGB.byte.tif
Rasterio 0.5.1 Interactive Interpreter
Type "src.name", "src.read_band(1)", or "help(src)" for more information.
>>>

Typing in the first two suggested expressions gives you useful entry points.

>>> src.name
'rasterio/tests/data/RGB.byte.tif'
>>> src.read_band(1)
array([[0, 0, 0, ..., 0, 0, 0],
       [0, 0, 0, ..., 0, 0, 0],
       [0, 0, 0, ..., 0, 0, 0],
       ...,
       [0, 0, 0, ..., 0, 0, 0],
       [0, 0, 0, ..., 0, 0, 0],
       [0, 0, 0, ..., 0, 0, 0]], dtype=uint8)

it's a bit like gdalinfo on steroids. You can get statistics by using Numpy ndarray methods, because rasterio has ndarrays instead of band objects.

>>> red = src.read_band(1)
>>> red.min(), red.max(), red.mean()
(0, 255, 29.94772668847656)

Fiona's inspector is in the fiona.inspector module.

$ python -m fiona.inspector docs/data/test_uk.shp
Fiona 1.1.1 Interactive Inspector
Type "src.name", "src.schema", "next(src)", or "help(src)" for more information.
>>>

Its suggested expressions give you (with the help of pprint.pprint()):

>>> src.name
u'test_uk'
>>> import pprint
>>> pprint.pprint(src.schema)
{'geometry': 'Polygon',
 'properties': OrderedDict([(u'CAT', 'float:16'), (u'FIPS_CNTRY', 'str'), (u'CNTRY_NAME', 'str'), (u'AREA', 'float:15.2'), (u'POP_CNTRY', 'float:15.2')])}
>>> pprint.pprint(next(src))
{'geometry': {'coordinates': [[(0.899167, 51.357216),
                               (0.885278, 51.35833),
                               (0.7875, 51.369438),
                               (0.781111, 51.370552),
                               (0.766111, 51.375832),
                               (0.759444, 51.380829),
                               (0.745278, 51.39444),
                               (0.740833, 51.400276),
                               (0.735, 51.408333),
                               (0.740556, 51.429718),
                               (0.748889, 51.443604),
                               (0.760278, 51.444717),
                               (0.791111, 51.439995),
                               (0.892222, 51.421387),
                               (0.904167, 51.418884),
                               (0.908889, 51.416939),
                               (0.930555, 51.398888),
                               (0.936667, 51.393608),
                               (0.943889, 51.384995),
                               (0.9475, 51.378609),
                               (0.947778, 51.374718),
                               (0.946944, 51.371109),
                               (0.9425, 51.369164),
                               (0.904722, 51.358055),
                               (0.899167, 51.357216)]],
              'type': 'Polygon'},
 'id': '0',
 'properties': OrderedDict([(u'CAT', 232.0), (u'FIPS_CNTRY', u'UK'), (u'CNTRY_NAME', u'United Kingdom'), (u'AREA', 244820.0), (u'POP_CNTRY', 60270708.0)]),
 'type': 'Feature'}

I'd like to have proper program names for these soon instead of "python -m rasterio.tool", but haven't thought of any yet. Also, I will gladly accept patches that would use your own favorite other interpreters (bpython, IPython) if available.